










- 14th October 2026
Table of Contents
- Glucose Variability: Why HbA1c Does Not Tell the Whole Story
- What Is Glucose Variability?
- Why Can Two People With the Same HbA1c Have Different Glucose Patterns?
- Understanding What HbA1c Actually Measures
- Estimated Average Glucose: Useful but Incomplete
- Why Average Glucose Can Hide Hypoglycaemia
- How Is Glucose Variability Measured?
- What Is Time in Range?
- Time Below Range: An Essential Safety Metric
- Time Above Range: Understanding Hyperglycaemic Exposure
- Understanding the Main CGM Metrics
- What Is the Glucose Management Indicator?
- When HbA1c May Be Misleading for Reasons Beyond Glucose Variability
- Does Greater Glucose Variability Mean Greater Complication Risk?
- Why Glucose Variability Matters Even When HbA1c Is at Target
- How Continuous Glucose Monitoring Helps Us Understand Glucose Variability
- What Does a Continuous Glucose Monitoring Report Show?
- What Is the Ambulatory Glucose Profile?
- How Much CGM Data Is Needed for Reliable Interpretation?
- How to Read a CGM Report Step by Step
- Why Hypoglycaemia Should Be Reviewed Before Glucose Spikes
- Understanding Time Below Range
- Can CGM Show False Hypoglycaemia?
- Why CGM and Finger-Stick Glucose Can Differ
- Post-Meal Glucose Spikes: When Are They Important?
- Why Fasting Glucose Can Be Normal While HbA1c Is Elevated
- Why Morning Glucose May Be High
- Why Exercise Can Produce Different Glucose Responses
- How Sleep and Stress Influence Glucose Patterns
- Understanding Glucose Variability in Type 1 Diabetes
- Understanding Glucose Variability in Type 2 Diabetes
- Can People Without Diabetes Have Glucose Variability?
- Common CGM Patterns and Their Possible Explanations
- Why CGM Data Should Be Reviewed Alongside a Daily Record
- How Can Glucose Variability Be Managed?
- Why Reducing Glucose Variability Should Not Mean Eliminating Carbohydrates
- How Protein and Fibre Can Influence Post-Meal Glucose
- Indian Meal Choices and Glucose Variability
- Does Eating Food in a Particular Order Reduce Glucose Spikes?
- Should People With Diabetes Eat Every Two Hours?
- How Walking After Meals May Help Glucose Control
- Why Resistance Training Matters for Glucose Variability
- Why Sleep Quality Can Affect Glucose Patterns
- Stress, Illness and Glucose Variability
- Medication Review: A Critical Part of Managing Glucose Variability
- Can GLP-1-Based Treatments Reduce Glucose Variability?
- When Is Continuous Glucose Monitoring Particularly Useful?
- How Should Patients Respond to a High CGM Reading?
- How Should Hypoglycaemia Be Treated?
- Should We Aim for the Lowest Possible HbA1c?
- Glucose Variability vs HbA1c: What Should Be Prioritised?
- Common Myths About Glucose Variability
- Myth 1: If My HbA1c Is Normal, My Glucose Never Goes Too High or Too Low
- Myth 2: Every Glucose Spike Damages Blood Vessels
- Myth 3: A Flat CGM Line Is the Ultimate Goal
- Myth 4: Rice and Roti Must Be Completely Avoided
- Myth 5: CGM Is Always More Accurate Than a Finger-Stick Meter
- Myth 6: Lower HbA1c Is Always Better
- Myth 7: Everyone Without Diabetes Should Wear a CGM
- Myth 8: A Glucose Variability CV Below 36% Means There Is No Risk
- Frequently Asked Questions About Glucose Variability
- When Should You Consult a Doctor About Glucose Fluctuations?
- What I Explain to Patients About Glucose Variability
- Key Takeaways About Glucose Variability
- Consultation for Diabetes and Glucose Management in Dwarka, Delhi
- References
Glucose Variability: Why HbA1c Does Not Tell the Whole Story
Two patients visit a diabetes clinic on the same day. Both have type 2 diabetes. Both have an HbA1c of 7.0%. At first glance, their diabetes control appears similar.
However, their daily glucose patterns tell very different stories.
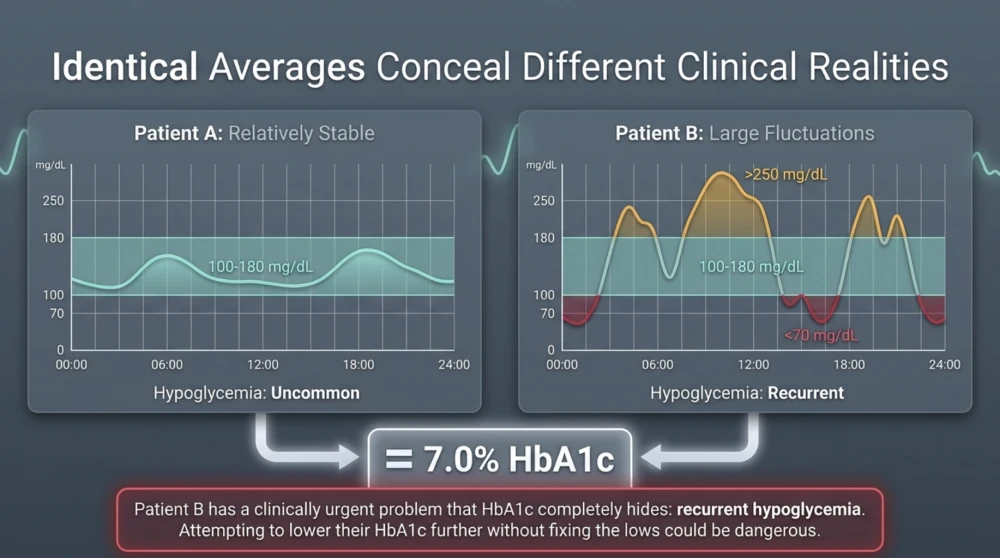
The first patient has glucose readings that generally remain between 100 and 180 mg/dL. There are modest rises after meals, followed by gradual returns towards baseline. Hypoglycaemia is uncommon.
The second patient has repeated glucose spikes above 250 mg/dL after meals, followed by substantial declines. On some days, glucose falls below 70 mg/dL, particularly overnight or after physical activity.
Despite these differences, both patients may have an identical HbA1c.
This is where glucose variability becomes clinically important.
HbA1c provides valuable information about average glycaemic exposure over approximately the previous two to three months. However, it cannot show how frequently glucose rises, how low it falls, or how much time a person spends outside a clinically appropriate range.
Two people with the same HbA1c can therefore have very different glucose patterns, hypoglycaemia exposure and treatment requirements.
It is important not to overinterpret this difference. Greater glucose variability does not automatically establish that one individual will develop more complications than another. The relationship between variability and long-term outcomes is complex, and the strongest evidence for treatment decisions concerns overall glucose exposure and avoidance of clinically significant hypoglycaemia.
Nevertheless, understanding glucose variability helps clinicians interpret HbA1c more intelligently and personalise diabetes management.
What Is Glucose Variability?
Glucose variability, also called glycaemic variability, describes the extent to which blood glucose concentrations fluctuate over time.
Glucose is not expected to remain constant throughout the day. Even in people without diabetes, concentrations rise after meals and change in response to physical activity, hormones, sleep and other physiological factors.
These fluctuations are normal.
In diabetes, however, glucose excursions may become larger, more prolonged or more unpredictable.
Some people experience substantial post-meal hyperglycaemia. Others have frequent hypoglycaemic episodes, particularly when using insulin or certain glucose-lowering medicines.
Glucose variability provides a way to describe these patterns beyond a single average value.
Normal Glucose Fluctuations Are Not the Same as Harmful Variability
A rise in glucose after eating is a normal physiological response.
For example, a person without diabetes may experience a modest glucose increase after a carbohydrate-containing meal, followed by a return towards their usual baseline.
The presence of a glucose rise does not automatically mean that the meal was unhealthy or that the person has insulin resistance.
The clinical significance depends on the magnitude, duration and context of the glucose excursion, along with the person's diagnosis and treatment.
Why Can Two People With the Same HbA1c Have Different Glucose Patterns?
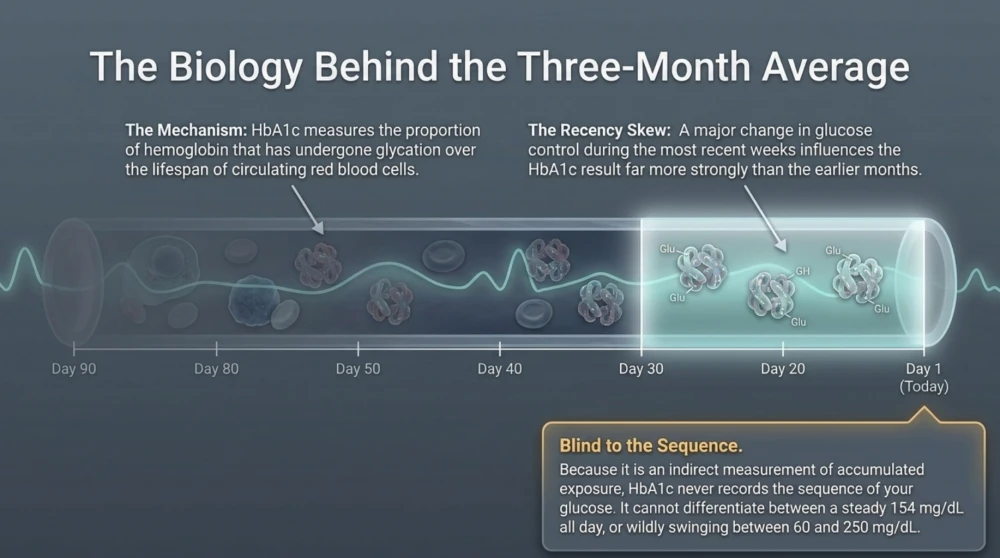
HbA1c reflects the proportion of haemoglobin that has undergone glycation during the lifespan of circulating red blood cells.
Because glucose exposure accumulates over time, HbA1c generally correlates with average glucose concentration.
However, it does not preserve information about the sequence of glucose readings.
Consider two hypothetical patients.
| Characteristic | Patient A | Patient B |
|---|---|---|
| HbA1c | 7.0% | 7.0% |
| Typical glucose pattern | Relatively stable | Large fluctuations |
| Post-meal glucose | Moderate excursions | Repeated high excursions |
| Hypoglycaemia | Uncommon | Recurrent episodes |
| Potential clinical concern | Average glycaemic exposure | Average exposure plus hypoglycaemia and substantial excursions |
These are illustrative patterns, not actual patient measurements.
The patients have the same HbA1c, but the second patient has a clinically important problem that the HbA1c does not reveal: recurrent hypoglycaemia.
For this patient, simply attempting to lower HbA1c further could be inappropriate unless the causes of hypoglycaemia are addressed.
Understanding What HbA1c Actually Measures
HbA1c is one of the most useful tests in diabetes care.
It helps assess longer-term glycaemic exposure and has an established relationship with the risk of certain diabetes-related complications.
However, it is an indirect measurement.
It does not continuously measure circulating glucose. Instead, it reflects glycation of haemoglobin over time.
Why Recent Glucose Levels Can Influence HbA1c More Strongly
Although HbA1c is commonly described as reflecting the previous two to three months, glucose exposure during more recent weeks contributes substantially to the result.
Therefore, a major change in treatment or glucose control may begin to influence HbA1c before three months have passed.
This also means that HbA1c should not be interpreted as a simple arithmetic average of every glucose reading collected over exactly 90 days.
Estimated Average Glucose: Useful but Incomplete
HbA1c can be converted into an estimated average glucose, commonly abbreviated as eAG.
For example, an HbA1c of 7.0% corresponds to an estimated average glucose of approximately 154 mg/dL.
However, this estimated average cannot tell us whether glucose remained near 154 mg/dL throughout the day or alternated between very high and low concentrations.
That distinction is central to understanding glucose variability.
Why Average Glucose Can Hide Hypoglycaemia
Imagine that a person spends several hours with glucose substantially above their target range and several other hours below it.
When these values are averaged, the resulting number may appear acceptable.
But the average conceals clinically relevant exposure at both extremes.
Hypoglycaemia is particularly important because it can cause immediate symptoms and, when severe, may result in confusion, seizures, loss of consciousness or injury.
In people treated with insulin or insulin secretagogues, recognising repeated lows is therefore an essential part of safe diabetes management.
A Lower HbA1c Is Not Always Better if It Comes With Frequent Lows
An HbA1c result should be interpreted alongside the treatment regimen and the patient's experience of hypoglycaemia.
For someone experiencing recurrent low glucose, the immediate priority may be to reduce hypoglycaemia rather than intensify glucose-lowering treatment.
Individual HbA1c goals depend on factors such as age, comorbidities, life expectancy, treatment burden and hypoglycaemia risk.
How Is Glucose Variability Measured?
Several statistical methods can describe glucose fluctuations.
In contemporary diabetes care, continuous glucose monitoring (CGM) provides a practical way to examine glucose patterns across the day and night.
CGM devices measure glucose in interstitial fluid and generate repeated measurements over time.
These data can be summarised using standardised metrics.
Standard Deviation of Glucose
Standard deviation describes the spread of glucose readings around their mean.
A larger standard deviation indicates greater dispersion of measured values.
However, standard deviation is influenced by the average glucose concentration. This limits its usefulness when comparing people with different mean glucose levels.
Coefficient of Variation
The coefficient of variation, commonly abbreviated as CV, expresses glucose standard deviation relative to mean glucose.
It is calculated as:
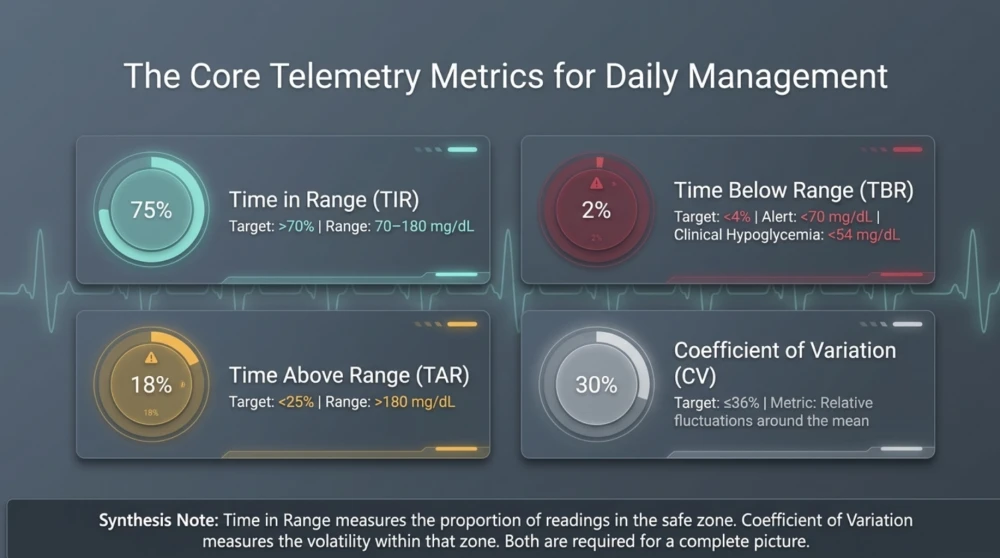
CV (%) = (Glucose standard deviation ÷ Mean glucose) × 100
Because CV accounts for the mean, it is particularly useful for comparing relative glucose variability.
In international CGM consensus recommendations, a glucose CV of 36% or less is commonly used as a target for many people with diabetes.
However, this threshold should not be interpreted as a universal diagnostic boundary between safe and unsafe glucose patterns.
Hypoglycaemia exposure, overall glucose control and individual clinical circumstances remain important.
What Is Time in Range?
Time in range (TIR) describes the percentage of time glucose remains within a specified target interval.
For many non-pregnant adults with type 1 or type 2 diabetes, the commonly used CGM target range is 70–180 mg/dL.
The frequently recommended general target is to spend more than 70% of time within this range, although targets should be individualised.
Time in range adds information that HbA1c alone cannot provide.
It shows how much of the monitored period is spent within a clinically relevant glucose interval.
Why Time in Range and Glucose Variability Are Different
Time in range measures the proportion of readings within the selected interval.
Glucose variability describes the degree of fluctuation.
These concepts are related but not identical.
Two patients may have similar time in range but different patterns of glucose movement within that range.
Similarly, a patient may have substantial glucose variability while still spending considerable time within the target interval.
Time Below Range: An Essential Safety Metric
Time below range (TBR) describes the percentage of monitored time spent below a specified glucose threshold.
For many adults with diabetes, CGM reports commonly distinguish:
- Below 70 mg/dL: level 1 hypoglycaemia range.
- Below 54 mg/dL: level 2 hypoglycaemia range, which is clinically significant.
For many non-pregnant adults with diabetes, consensus CGM targets include less than 4% of time below 70 mg/dL and less than 1% below 54 mg/dL.
Stricter hypoglycaemia-avoidance targets may be appropriate for older adults or those at higher risk.
These thresholds are diabetes-management targets, not diagnostic criteria for spontaneous hypoglycaemia in people without diabetes.
Time Above Range: Understanding Hyperglycaemic Exposure
Time above range (TAR) describes the percentage of time glucose remains above a specified threshold.
Common CGM reporting categories include glucose above 180 mg/dL and above 250 mg/dL.
For many non-pregnant adults with diabetes, general consensus targets include less than 25% of time above 180 mg/dL and less than 5% above 250 mg/dL.
These measures help identify persistent hyperglycaemia that may not be obvious from occasional fasting glucose measurements.
Understanding the Main CGM Metrics
| CGM Metric | What It Shows | Clinical Relevance |
|---|---|---|
| Mean glucose | Average sensor glucose | Overall glycaemic exposure during monitoring |
| Glucose CV | Relative glucose variability | Helps assess fluctuations and hypoglycaemia-related patterns |
| Time in range | Time between 70 and 180 mg/dL | Shows time within a common diabetes target interval |
| Time below range | Time below 70 or 54 mg/dL | Important for hypoglycaemia safety |
| Time above range | Time above 180 or 250 mg/dL | Identifies hyperglycaemic exposure |
| Glucose management indicator | CGM-derived estimate based on mean glucose | Helps compare recent CGM exposure with laboratory HbA1c |
What Is the Glucose Management Indicator?
The glucose management indicator (GMI) is calculated from mean CGM glucose.
It provides an HbA1c-like percentage that helps describe recent glucose exposure.
However, GMI is not the same measurement as laboratory HbA1c.
Differences between GMI and HbA1c can occur because of individual variation in red blood cell biology, the duration of CGM monitoring and changes in recent glucose control.
A persistent or substantial difference deserves interpretation rather than automatically assuming that one result is incorrect.
When HbA1c May Be Misleading for Reasons Beyond Glucose Variability
Glucose variability is not the only limitation of HbA1c.
Conditions affecting red blood cell lifespan or haemoglobin measurement can alter the relationship between HbA1c and actual glucose exposure.
Examples include certain anaemias, haemoglobin variants, recent blood loss or transfusion and some situations involving advanced kidney disease.
The direction of the effect depends on the underlying condition and the laboratory method.
Why HbA1c Should Be Interpreted Alongside Clinical Information
If laboratory HbA1c does not match home glucose readings or CGM patterns, clinicians should consider both changes in glucose exposure and factors affecting HbA1c reliability.
This is particularly important when treatment decisions could increase hypoglycaemia risk.
Does Greater Glucose Variability Mean Greater Complication Risk?
This is an area of ongoing research.
Observational studies have reported associations between measures of glycaemic variability and several adverse outcomes.
However, these associations do not necessarily prove that glucose fluctuations independently cause complications.
People with greater variability may also differ in average glucose exposure, diabetes duration, medication use, hypoglycaemia frequency and other risk factors.
It is therefore important to avoid claiming that every post-meal glucose spike causes vascular damage or that reducing variability alone has been proven to prevent complications independently of other changes.
What is well established is that recurrent hypoglycaemia deserves attention and that sustained glycaemic management is important for reducing diabetes-related complications.
Why Glucose Variability Matters Even When HbA1c Is at Target
A patient may achieve an individualised HbA1c target while continuing to experience recurrent hypoglycaemia, prolonged post-meal hyperglycaemia or unpredictable glucose excursions.
These patterns may affect treatment safety, daily functioning and the patient's ability to manage diabetes.
CGM can help reveal such patterns and support more targeted treatment adjustments.
For example, identifying repeated overnight lows may prompt a review of basal insulin or other glucose-lowering treatment.
Repeated post-meal excursions may lead to assessment of meal composition, medication timing or other contributing factors.
The goal is not to produce a perfectly flat glucose line. It is to improve clinically meaningful glucose outcomes while avoiding unnecessary treatment burden and hypoglycaemia.
How Continuous Glucose Monitoring Helps Us Understand Glucose Variability
When a patient brings an HbA1c report to a diabetes consultation, the result provides an important overview of longer-term glucose exposure. However, it cannot show what happens to glucose throughout the day and night.
This is where continuous glucose monitoring (CGM) becomes particularly useful.
CGM provides repeated measurements of glucose in the interstitial fluid, allowing clinicians and patients to examine patterns that may be missed by occasional finger-stick measurements.
For example, two people may have the same HbA1c but very different glucose patterns. One may remain within the recommended glucose range for most of the day, while the other experiences repeated episodes of hyperglycaemia and hypoglycaemia.
These differences are central to understanding glucose variability.
However, CGM is not a perfect measurement system. Sensor glucose is not identical to blood glucose, and individual readings require interpretation in the context of symptoms, treatment and device limitations.
What Does a Continuous Glucose Monitoring Report Show?
A standard CGM report provides more information than a collection of glucose readings.
It usually includes average sensor glucose, time in range, time above range, time below range, glucose variability and a graphical representation of glucose patterns.
One commonly used summary is the Ambulatory Glucose Profile (AGP).
The AGP combines glucose information from multiple days into a standardised 24-hour display.
This allows clinicians to identify recurring patterns, such as overnight hypoglycaemia, morning hyperglycaemia or glucose excursions following particular meals.
Why a Single Glucose Reading Is Often Insufficient
Suppose a patient measures glucose at 8 AM and obtains a reading of 115 mg/dL.
This result may appear reassuring, but it tells us very little about glucose concentrations during the preceding night or following breakfast.
The patient may have experienced prolonged overnight hyperglycaemia, a nocturnal low or substantial post-breakfast excursions that are not captured by that one measurement.
CGM helps identify such patterns when adequate monitoring data are available.
What Is the Ambulatory Glucose Profile?
The Ambulatory Glucose Profile is a graphical summary of glucose measurements collected over several days.
Instead of displaying each day separately, it combines the data to illustrate typical glucose patterns over a 24-hour period.
The graph commonly shows a median glucose line and shaded areas representing the distribution of readings.
The median line represents the middle glucose value at each time of day across the monitoring period.
The shaded bands indicate how widely glucose readings vary around that median.
How to Interpret the Median Glucose Line
A median line that remains within the target range for much of the day may suggest reasonably consistent glucose exposure during those periods.
However, the median can conceal individual days with clinically important hypoglycaemia or hyperglycaemia.
For this reason, the median should always be interpreted alongside the variability bands and the time-below-range data.
What Do Wide Shaded Bands Mean?
Wide shaded bands indicate greater dispersion of glucose readings at a particular time of day.
For example, a broad band after lunch may suggest that glucose responses vary considerably between days.
Possible explanations include differences in meal composition, carbohydrate portions, physical activity, medication timing or other factors.
However, the AGP graph alone cannot establish the cause of a pattern.
How Much CGM Data Is Needed for Reliable Interpretation?
The amount and completeness of CGM data influence how confidently patterns can be interpreted.
International consensus recommendations commonly use approximately 14 days of CGM data, with at least 70% active sensor data, as a practical basis for reviewing glucose patterns in many people with diabetes.
However, a longer monitoring period may be necessary when glucose patterns vary substantially or when the available data do not represent usual daily activities.
For example, two weeks of CGM collected during an acute illness, unusual travel schedule or temporary medication change may not reflect the patient's typical glucose control.
How to Read a CGM Report Step by Step
A systematic approach helps prevent overreaction to isolated readings.
Rather than beginning with the highest glucose spike, clinicians generally benefit from first assessing data quality, hypoglycaemia exposure and overall glucose distribution.
| Review Step | What to Examine | Why It Matters |
|---|---|---|
| 1. Data quality | Monitoring duration and active sensor percentage | Determines whether the report is sufficiently representative |
| 2. Hypoglycaemia | Time below 70 and 54 mg/dL | Identifies potentially important treatment-safety concerns |
| 3. Time in range | Percentage between 70 and 180 mg/dL | Summarises time within a common diabetes target interval |
| 4. Hyperglycaemia | Time above 180 and 250 mg/dL | Identifies prolonged or repeated high glucose exposure |
| 5. Variability | Coefficient of variation and AGP spread | Helps describe the extent of glucose fluctuations |
| 6. Daily patterns | Meal timing, sleep, exercise and medication use | Helps identify potentially modifiable contributors |
Why Hypoglycaemia Should Be Reviewed Before Glucose Spikes
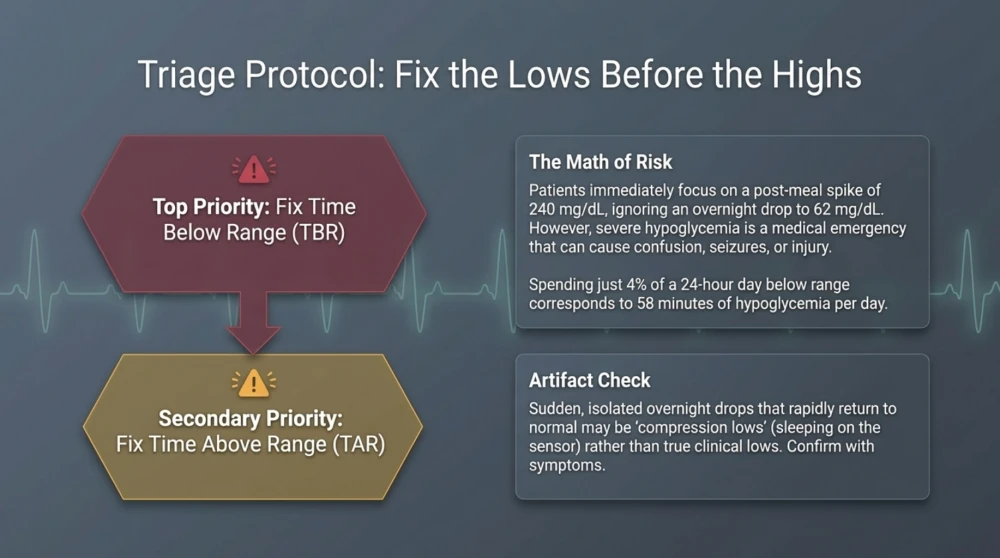
When reviewing a CGM report, patients often focus immediately on the highest glucose value.
A post-meal reading of 240 mg/dL may attract more attention than an overnight reading of 62 mg/dL.
However, hypoglycaemia may require more immediate attention, particularly in patients receiving insulin or sulfonylureas.
Severe hypoglycaemia can cause confusion, seizures, loss of consciousness and injury.
Therefore, clinically important low-glucose patterns should generally be addressed before intensifying treatment solely to reduce hyperglycaemia.
Understanding Time Below Range
Time below range describes the proportion of CGM readings below a selected glucose threshold.
For many non-pregnant adults with diabetes, the commonly used thresholds are below 70 mg/dL and below 54 mg/dL.
Glucose below 70 mg/dL represents an important alert threshold in diabetes management.
Glucose below 54 mg/dL represents clinically significant biochemical hypoglycaemia.
These thresholds are particularly relevant when assessing the safety of glucose-lowering treatment.
Why Even a Small Percentage of Time Below Range Can Matter
A percentage can appear small until it is converted into time.
For example, 4% of a 24-hour day is approximately 58 minutes.
Therefore, spending 4% of time below 70 mg/dL corresponds to nearly one hour per day on average during the monitoring period.
This illustrates why time below range deserves attention even when HbA1c appears acceptable.
However, CGM measurements in the low range can be less accurate, and suspicious readings should be interpreted with appropriate confirmation when necessary.
Can CGM Show False Hypoglycaemia?
Yes.
CGM measures glucose in interstitial fluid rather than directly measuring plasma glucose.
Sensor readings may differ from blood glucose, particularly during rapid changes.
In addition, pressure applied to a sensor during sleep can sometimes produce falsely low readings.
These are often called compression lows.
What Is a Compression Low?
Suppose a person sleeps directly on the arm where the CGM sensor is attached.
Local pressure may interfere with the sensor's glucose measurement.
The CGM graph may show a sudden decline followed by a rapid return to previous values after the pressure is relieved.
This pattern can suggest a sensor artefact, although it does not prove one.
If a sensor reading does not match symptoms or clinical circumstances, a finger-stick glucose measurement may help clarify the situation.
Symptoms of severe hypoglycaemia should never be ignored while waiting for perfect confirmation.
Why CGM and Finger-Stick Glucose Can Differ
CGM measures interstitial glucose, whereas a conventional home glucose meter measures capillary blood glucose.
During relatively stable conditions, these measurements may be reasonably close.
During rapid glucose changes, however, interstitial glucose can lag behind changes in blood glucose.
This difference can become noticeable after meals, during exercise or following treatment of hypoglycaemia.
A Rapidly Falling CGM Line Is Not Automatically an Emergency
The direction and speed of glucose change matter, but the absolute glucose value and clinical context are equally important.
A decline from 230 mg/dL to 130 mg/dL may appear dramatic on a graph.
However, 130 mg/dL is not hypoglycaemia.
The appropriate response depends on the current glucose level, rate of change, medication use and symptoms.
Post-Meal Glucose Spikes: When Are They Important?
Glucose normally rises after eating.
The magnitude and duration of the rise depend on several factors, including carbohydrate quantity, food composition, gastric emptying, insulin secretion, insulin sensitivity and medication use.
In diabetes, post-meal glucose excursions may become exaggerated or prolonged.
Repeated elevations can contribute to overall hyperglycaemic exposure.
However, one isolated glucose peak does not independently establish poor diabetes control or predict future complications.
Peak Glucose and Duration Are Different
Consider two hypothetical meals.
After the first meal, glucose briefly rises to 190 mg/dL and returns towards baseline relatively quickly.
After the second meal, glucose remains above 180 mg/dL for several hours.
Although both meals may produce a similar peak, the second pattern creates greater time above range.
This is one reason the duration of hyperglycaemia is important when interpreting CGM data.
Why Fasting Glucose Can Be Normal While HbA1c Is Elevated
Some people with type 2 diabetes have fasting glucose values that appear reasonably controlled but experience substantial glucose elevations after meals.
For example, a patient may repeatedly record fasting glucose around 110–125 mg/dL while developing prolonged post-meal readings above 200 mg/dL.
These excursions can contribute to an elevated HbA1c despite apparently acceptable fasting readings.
CGM or appropriately timed self-monitoring can help reveal this pattern.
Why Morning Glucose May Be High
Morning hyperglycaemia can occur for several reasons.
One recognised contributor is the dawn phenomenon, in which early-morning hormonal changes increase hepatic glucose production and alter insulin requirements.
Other contributors may include insufficient overnight glucose-lowering medication, late meals or other factors.
It is important not to assume that every high morning glucose reading results from overnight hypoglycaemia.
Dawn Phenomenon vs Overnight Hypoglycaemia
The dawn phenomenon generally involves rising glucose towards morning without a preceding low-glucose episode.
Overnight hypoglycaemia followed by morning hyperglycaemia is sometimes described as a rebound phenomenon, but it should not be assumed without supporting measurements.
CGM can help distinguish these patterns by showing what happened during the night.
Why Exercise Can Produce Different Glucose Responses
Physical activity can influence glucose in several ways.
Moderate aerobic exercise often lowers glucose during or after activity, particularly when circulating insulin is sufficient.
Resistance training or high-intensity exercise may produce different short-term responses, including temporary glucose increases in some individuals.
The response depends on exercise intensity, duration, timing, food intake, fitness and medication use.
Therefore, a temporary glucose rise during exercise does not necessarily indicate that the activity is harmful.
Exercise and Delayed Hypoglycaemia
People using insulin or insulin secretagogues may experience hypoglycaemia during exercise or several hours afterwards.
CGM can help identify patterns of delayed hypoglycaemia, including overnight lows following prolonged activity.
Medication and carbohydrate strategies should be individualised rather than applying one universal rule.
How Sleep and Stress Influence Glucose Patterns
Glucose concentrations are influenced by more than food intake.
Sleep restriction, acute illness, emotional stress and certain medications can affect glucose regulation.
Stress hormones may increase hepatic glucose production and alter insulin sensitivity.
Poor sleep can also affect appetite and behavioural choices.
However, not every glucose increase during a stressful period is directly caused by stress, and the CGM graph alone cannot determine the mechanism.
Understanding Glucose Variability in Type 1 Diabetes
Glucose variability is particularly important in type 1 diabetes because insulin delivery must be matched with changing physiological requirements.
Meal carbohydrate, insulin timing, exercise, illness and other factors can substantially influence glucose patterns.
CGM can help identify both hyperglycaemia and hypoglycaemia, including episodes that occur during sleep.
For people using automated insulin delivery systems, CGM data also support algorithm-guided insulin adjustments.
However, device settings and treatment decisions require appropriate clinical oversight.
Understanding Glucose Variability in Type 2 Diabetes
In type 2 diabetes, glucose patterns vary according to disease stage, residual insulin secretion, insulin resistance, medication use and daily habits.
Some patients experience predominantly fasting hyperglycaemia.
Others have substantial post-meal excursions.
Patients receiving insulin or sulfonylureas may also experience clinically important hypoglycaemia.
CGM can be especially useful when HbA1c does not adequately explain symptoms or when treatment decisions depend on identifying glucose patterns.
Can People Without Diabetes Have Glucose Variability?
Yes.
Glucose changes throughout the day in people without diabetes.
Meals, exercise, sleep and hormonal responses all influence glucose concentrations.
However, CGM targets developed for diabetes management should not automatically be applied to healthy individuals.
There is insufficient evidence to recommend that every person without diabetes continuously monitor glucose or attempt to eliminate all post-meal glucose rises.
A Normal Glucose Rise Does Not Need to Be Flattened at Any Cost
Some people become anxious when CGM shows a glucose rise after rice, fruit or another carbohydrate-containing food.
However, a physiological glucose response is expected after eating.
Food quality, nutritional adequacy, physical activity and overall metabolic health are more important than achieving a perfectly flat sensor graph.
Common CGM Patterns and Their Possible Explanations
| CGM Pattern | Possible Contributors | Clinical Consideration |
|---|---|---|
| Repeated overnight lows | Medication effects, exercise or sensor artefact | Confirm when appropriate and review treatment safety |
| Morning glucose rise | Dawn phenomenon, overnight treatment factors or late food intake | Examine the preceding overnight pattern |
| Large breakfast excursions | Meal composition, carbohydrate quantity or medication timing | Review recurring meal-related patterns |
| Late post-exercise lows | Increased insulin sensitivity and medication effects | Consider individual exercise and treatment adjustments |
| Wide AGP variability bands | Variable meals, activity, treatment timing or other factors | Review daily records rather than guessing the cause |
| Abrupt isolated low during sleep | Possible compression artefact or true hypoglycaemia | Interpret with symptoms and confirm when needed |
Why CGM Data Should Be Reviewed Alongside a Daily Record
CGM can show when glucose rises or falls, but it cannot always explain why.
A simple record of meals, medication, exercise, sleep and symptoms can make the data more clinically useful.
For example, a recurring afternoon glucose rise may coincide with a particular lunch pattern, while overnight lows may follow unusually active days.
These observations can guide discussion and treatment decisions.
However, correlation does not always prove causation, and treatment changes should reflect the complete clinical picture.
How Can Glucose Variability Be Managed?
When patients see large glucose fluctuations on their continuous glucose monitoring (CGM) reports, their first reaction is often to eliminate carbohydrates or reduce their food intake drastically.
However, managing glucose variability is not about achieving a perfectly flat glucose line.
Glucose naturally changes throughout the day. It rises after meals, responds to physical activity and is influenced by sleep, stress, illness and medication.
The clinical goal is to improve meaningful glucose outcomes while avoiding hypoglycaemia, prolonged hyperglycaemia and unnecessary treatment burden.
For people with diabetes, management should be individualised according to diabetes type, medication use, hypoglycaemia risk, nutritional needs and overall health.
For example, a patient taking insulin who experiences repeated overnight hypoglycaemia needs a different approach from someone taking metformin alone who primarily experiences prolonged post-meal hyperglycaemia.
Although both patients may have the same HbA1c, their treatment priorities may differ considerably.
Why Reducing Glucose Variability Should Not Mean Eliminating Carbohydrates
Carbohydrate-containing foods are an important part of many balanced dietary patterns.
Foods such as rice, roti, dal, fruit, milk and vegetables contain carbohydrates in varying amounts.
Some also provide protein, fibre, vitamins and minerals.
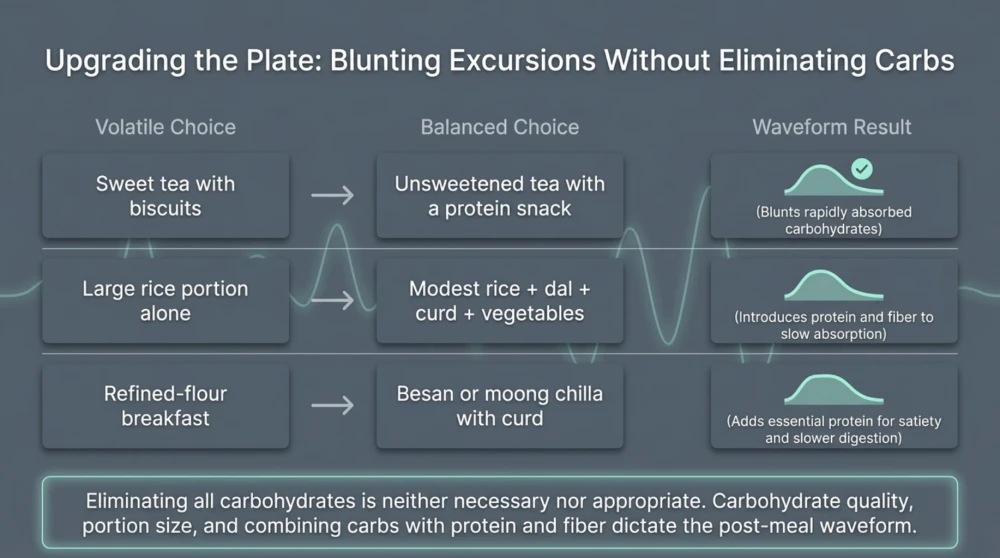
Eliminating all carbohydrates is neither necessary nor appropriate for every person with diabetes.
Instead, dietary management should consider carbohydrate quantity, food quality, meal composition and individual glucose responses.
Why Carbohydrate Quality Matters
Rapidly absorbed carbohydrate sources, particularly sugar-sweetened beverages and refined carbohydrate-rich meals, may produce relatively rapid glucose excursions.
However, the response depends on portion size, food preparation, accompanying nutrients and the individual's metabolic condition.
Whole grains, pulses, vegetables and whole fruits can be incorporated into a diabetes-friendly dietary pattern.
The goal is not to label individual foods as universally good or bad, but to create meals that support overall nutritional and metabolic health.
How Protein and Fibre Can Influence Post-Meal Glucose
Protein and fibre can influence the digestion and absorption of carbohydrate-containing meals.
Fibre-rich foods may slow carbohydrate absorption, while protein-containing foods can affect satiety and post-meal metabolic responses.
However, adding protein does not guarantee that a meal will produce a lower glucose peak in every individual.
Meal composition, total carbohydrate quantity and diabetes medication remain important.
A Practical Indian Breakfast Example
Consider a breakfast consisting mainly of sweet tea and white bread with jam.
For some people with diabetes, this may produce a relatively rapid post-meal glucose rise.
A breakfast containing moong dal chilla with curd, or eggs with whole-grain toast and vegetables, provides a different balance of carbohydrate, protein and fibre.
Such meals may support satiety and improve post-meal glucose patterns in some individuals.
However, the appropriate choice depends on the patient's dietary preferences, energy requirements and glucose-lowering treatment.
Indian Meal Choices and Glucose Variability
Indian meals can be balanced without removing familiar staple foods.
Rice, roti, dal, vegetables, curd and protein-rich foods can be combined according to individual needs.
The following table provides examples of meal adjustments that may be useful for some adults with diabetes.
| Common Meal Pattern | Possible Adjustment | Potential Benefit |
|---|---|---|
| Sweet tea with biscuits | Unsweetened or less-sweet tea with a protein-containing snack if needed | May reduce rapidly absorbed carbohydrate intake |
| Large rice portion with little protein | Appropriate rice portion with dal, vegetables and curd or another protein source | Improves meal balance |
| Fruit juice | Whole fruit in a suitable portion | Provides more intact fibre and may improve satiety |
| Refined-flour breakfast with little protein | Besan or moong chilla with curd | Provides additional protein and fibre |
| Sugary evening beverage | Unsweetened beverage with roasted chana if hungry | May reduce added sugar intake |
These are illustrative options rather than universal prescriptions. A patient using mealtime insulin may need carbohydrate consistency or insulin-dose adjustments rather than simply reducing carbohydrate intake.
Does Eating Food in a Particular Order Reduce Glucose Spikes?
Some studies suggest that consuming vegetables or protein before carbohydrate-rich foods may reduce post-meal glucose excursions under certain conditions.
However, these studies are often small and examine short-term glucose responses.
Evidence that meal sequencing independently reduces long-term diabetes complications is limited.
Patients may try a practical meal order if it suits their preferences, but it should not replace attention to total dietary quality, carbohydrate quantity and medication management.
Should People With Diabetes Eat Every Two Hours?
There is no universal requirement for people with diabetes to eat every two hours.
Meal frequency should be individualised.
Some patients manage well with three regular meals, while others benefit from planned snacks depending on hunger, medication use and daily activities.
Frequent eating is not automatically beneficial for glucose variability.
For patients using insulin or sulfonylureas, meal timing may be particularly important because delayed or missed meals can increase hypoglycaemia risk.
How Walking After Meals May Help Glucose Control
Physical activity increases skeletal muscle glucose uptake and can improve insulin sensitivity.
Walking after meals may help reduce post-meal glucose excursions in some people with type 2 diabetes.
Even a relatively short walk can be useful when performed consistently.
However, the effect varies according to exercise intensity, timing, baseline glucose and medication use.
A Practical Post-Meal Walking Routine
For an adult who can exercise safely, a comfortable walk after a meal may be a reasonable starting point.
Some patients begin with approximately 10–15 minutes and adjust according to fitness and tolerance.
This is not a mandatory duration or a replacement for broader physical activity recommendations.
People taking insulin or sulfonylureas should consider hypoglycaemia risk and follow individualised exercise guidance.
Why Resistance Training Matters for Glucose Variability
Skeletal muscle is an important site of glucose disposal.
Resistance training can improve muscular strength, preserve lean mass and support metabolic health.
For adults with type 2 diabetes, regular resistance exercise is an important component of comprehensive physical activity management.
However, a single resistance-training session may temporarily increase glucose in some individuals because of physiological stress responses.
This does not necessarily mean that the exercise is harmful.
Long-term exercise benefits should not be judged solely by one CGM reading.
Why Sleep Quality Can Affect Glucose Patterns
Sleep restriction and disturbed sleep can influence glucose regulation through changes in hormonal signalling, appetite and insulin sensitivity.
People who sleep poorly may also find it harder to maintain regular meals, physical activity and medication routines.
Obstructive sleep apnoea may contribute to disturbed sleep and metabolic abnormalities in susceptible individuals.
However, a high morning glucose reading does not establish that sleep apnoea is present.
Persistent snoring, witnessed breathing pauses and excessive daytime sleepiness should be evaluated on their own clinical merits.
Stress, Illness and Glucose Variability
Acute illness, infection, emotional stress and certain medications can increase glucose concentrations.
Stress hormones may increase hepatic glucose production and alter insulin sensitivity.
During illness, glucose patterns may become more unpredictable even when food intake decreases.
People using insulin should follow an individualised sick-day plan, including guidance on glucose monitoring, hydration, ketone testing when indicated and when to seek urgent care.
Insulin should not be stopped indiscriminately during illness, particularly in type 1 diabetes.
Medication Review: A Critical Part of Managing Glucose Variability
Not every glucose fluctuation can be corrected through diet or exercise.
Medication type, dose and timing may play an important role.
For example, insulin and sulfonylureas can cause hypoglycaemia, particularly when food intake or physical activity changes.
Other glucose-lowering medicines have a lower intrinsic risk of hypoglycaemia when used without insulin or insulin secretagogues.
Medication decisions should consider HbA1c, CGM patterns, kidney function, cardiovascular risk, weight-related concerns, affordability and patient preferences.
Insulin Timing and Post-Meal Excursions
In people using mealtime insulin, the timing and amount of insulin relative to food intake can influence glucose patterns.
Delayed insulin administration, carbohydrate-estimation errors or mismatches between insulin action and meal absorption may contribute to post-meal hyperglycaemia or subsequent hypoglycaemia.
These patterns require individualised review.
Patients should not independently make large insulin-dose changes solely in response to one CGM spike.
Can GLP-1-Based Treatments Reduce Glucose Variability?
GLP-1 receptor agonists and related incretin-based therapies can improve glycaemic control through mechanisms that may include glucose-dependent insulin secretion, suppression of inappropriate glucagon secretion and effects on gastric emptying.
Some treatments also support clinically meaningful weight reduction in appropriate patients.
By improving overall glucose regulation, these medicines may reduce certain hyperglycaemic excursions.
However, treatment selection should be based on established clinical indications rather than glucose variability alone.
Adverse effects, contraindications, cost and the potential need to adjust accompanying insulin or sulfonylurea treatment should be considered.
When Is Continuous Glucose Monitoring Particularly Useful?
CGM is especially valuable when detailed glucose patterns can influence treatment safety or clinical decisions.
It is widely used in type 1 diabetes and can be beneficial for many people with type 2 diabetes, particularly those using insulin.
It may also be useful in selected patients with recurrent hypoglycaemia, discordance between HbA1c and glucose readings, or difficulty understanding glucose patterns.
However, not every person with prediabetes or type 2 diabetes requires continuous sensor use.
The decision should consider clinical benefit, treatment type, cost, access and patient preference.
How Should Patients Respond to a High CGM Reading?
An isolated high sensor reading should be interpreted in context.
The patient should consider whether the reading occurred after a meal, during illness, after exercise or following a missed medication dose.
Repeated or sustained hyperglycaemia may require review of the treatment plan.
However, taking extra medication without an established correction plan can be dangerous.
Patients using insulin should follow their prescribed correction and sick-day instructions.
How Should Hypoglycaemia Be Treated?
For a conscious person with diabetes who has glucose below 70 mg/dL, approximately 15 grams of rapidly absorbed carbohydrate is a commonly recommended initial treatment, followed by reassessment after approximately 15 minutes.
If glucose remains below the treatment threshold, the treatment may need to be repeated according to the individual's diabetes action plan.
Examples of rapidly absorbed carbohydrate include glucose tablets or an appropriate measured quantity of glucose-containing drink.
Foods rich in fat, such as chocolate, are generally not preferred as first-line treatment because fat may slow carbohydrate absorption.
Severe Hypoglycaemia Is a Medical Emergency
If a person is unconscious, having a seizure or unable to swallow safely, nothing should be given by mouth.
Emergency medical assistance is required. Glucagon should be administered when available and appropriate by someone trained to use it.
CGM readings may lag behind blood glucose during recovery, so repeated treatment should not be based solely on a delayed sensor response.
Should We Aim for the Lowest Possible HbA1c?
No.
HbA1c targets should be individualised.
For many non-pregnant adults with diabetes, an HbA1c target below 7% may be appropriate, but this is not suitable for everyone.
Some patients may benefit from tighter targets when they can be achieved safely.
Others may require less stringent goals because of recurrent hypoglycaemia, serious comorbidities, frailty or other considerations.
A lower HbA1c achieved through frequent hypoglycaemia is not necessarily a better clinical outcome.
Glucose Variability vs HbA1c: What Should Be Prioritised?
HbA1c and CGM metrics should be viewed as complementary rather than competing measures.
HbA1c provides established information about longer-term glycaemic exposure.
CGM provides information about the distribution and timing of glucose concentrations.
Neither should be interpreted without considering the patient's symptoms, treatment regimen and overall health.
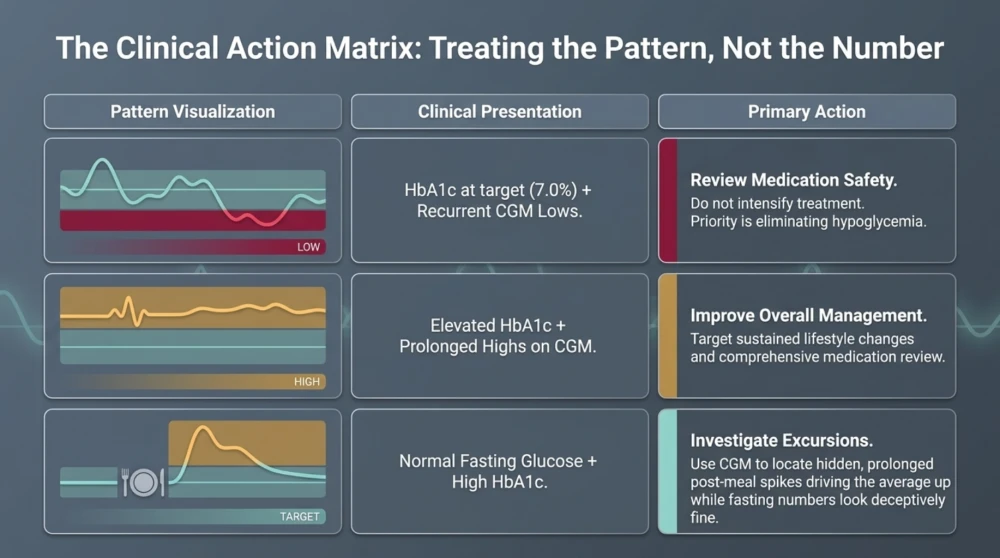
| Clinical Situation | Important Priority |
|---|---|
| HbA1c at target with recurrent hypoglycaemia | Reduce hypoglycaemia and review treatment safety |
| Elevated HbA1c with prolonged hyperglycaemia | Improve overall glycaemic management |
| Large post-meal excursions | Review meal patterns and treatment timing |
| CGM and HbA1c do not agree | Assess monitoring quality and possible HbA1c limitations |
| Stable glucose with acceptable HbA1c and low hypoglycaemia exposure | Maintain sustainable treatment and routine monitoring |
Common Myths About Glucose Variability
Myth 1: If My HbA1c Is Normal, My Glucose Never Goes Too High or Too Low
False. HbA1c reflects average glycaemic exposure and cannot identify individual glucose excursions or hypoglycaemia episodes.
Myth 2: Every Glucose Spike Damages Blood Vessels
This statement is too simplistic. Sustained hyperglycaemia is associated with diabetes complications, but the independent clinical impact of every brief glucose excursion is not established.
Myth 3: A Flat CGM Line Is the Ultimate Goal
False. Normal glucose physiology involves fluctuations. Diabetes management should focus on meaningful targets, treatment safety and overall health.
Myth 4: Rice and Roti Must Be Completely Avoided
False. Appropriate portions of these foods can fit within a balanced diabetes meal plan.
Myth 5: CGM Is Always More Accurate Than a Finger-Stick Meter
False. CGM has important advantages for trend monitoring, but sensor readings can differ from blood glucose, particularly during rapid changes or sensor artefacts.
Myth 6: Lower HbA1c Is Always Better
False. HbA1c goals must account for hypoglycaemia risk and individual clinical circumstances.
Myth 7: Everyone Without Diabetes Should Wear a CGM
False. Routine CGM use in otherwise healthy individuals without diabetes is not supported by sufficient evidence for universal recommendation.
Myth 8: A Glucose Variability CV Below 36% Means There Is No Risk
False. CV is one useful metric, but it does not replace assessment of time below range, overall glucose exposure or other clinical factors.
Frequently Asked Questions About Glucose Variability
1. What is glucose variability in simple terms?
Glucose variability describes how much glucose rises and falls over time. It provides information about fluctuations that may not be visible from HbA1c alone.
2. Can two people have the same HbA1c but different glucose patterns?
Yes. One person may have relatively stable glucose while another experiences repeated highs and lows. HbA1c does not describe how glucose values are distributed throughout the day.
3. What is a good glucose variability percentage?
A coefficient of variation of 36% or less is a commonly used consensus target for many people with diabetes. However, it should be interpreted alongside hypoglycaemia exposure and other CGM metrics.
4. What is a good time-in-range percentage?
For many non-pregnant adults with diabetes, spending more than 70% of time between 70 and 180 mg/dL is a commonly recommended general target. Individual targets may differ.
5. Does glucose variability cause diabetes complications?
Greater variability has been associated with some adverse outcomes in observational studies. However, its independent causal contribution to long-term complications remains less certain than the established importance of overall glycaemic exposure and hypoglycaemia prevention.
6. Can walking after meals reduce glucose spikes?
Walking after meals may reduce post-meal glucose excursions in some people with diabetes. The effect varies with activity, medication and individual metabolic responses.
7. Is continuous glucose monitoring necessary for every person with type 2 diabetes?
No. CGM can be particularly useful for people using insulin and others whose treatment decisions benefit from detailed glucose patterns. The need should be individualised.
8. Can stress increase glucose variability?
Stress can influence glucose regulation through hormonal and behavioural pathways. However, CGM patterns alone cannot establish stress as the cause of a particular glucose rise.
9. Why does my CGM show low glucose when I feel normal?
Some people have asymptomatic hypoglycaemia, while others may experience sensor artefacts or measurement differences. Unexpected readings should be interpreted according to the device instructions and clinical circumstances, with finger-stick confirmation when appropriate.
10. Can glucose variability improve without major weight loss?
Yes. Changes in meal composition, physical activity, medication timing and treatment may improve glucose patterns even without substantial weight reduction. The effect depends on the individual.
When Should You Consult a Doctor About Glucose Fluctuations?
Medical review is particularly important when glucose fluctuations are frequent, unexplained or associated with symptoms.
- Repeated glucose readings below 70 mg/dL.
- Any confirmed glucose below 54 mg/dL.
- Severe hypoglycaemia requiring assistance.
- Persistent or recurrent substantial hyperglycaemia.
- Frequent overnight lows.
- Marked disagreement between HbA1c and home glucose or CGM data.
- Unexplained symptoms despite apparently acceptable HbA1c.
- Difficulty adjusting insulin safely around meals or exercise.
Severe symptoms such as confusion, seizures, loss of consciousness, persistent vomiting, significant dehydration or signs of diabetic ketoacidosis require urgent medical attention rather than a routine appointment.
What I Explain to Patients About Glucose Variability
When a patient tells me that their HbA1c is 7% but their glucose readings are fluctuating widely, I explain that HbA1c is an important measurement, but it does not describe the complete glucose pattern.
I first want to know whether the patient is experiencing hypoglycaemia.
I then look at the frequency and duration of hyperglycaemia, medication use, meal patterns, physical activity and other relevant factors.
If CGM data are available, I review time below range, time in range, time above range and glucose variability together.
I do not advise patients to eliminate rice, roti or fruit simply because a sensor shows a temporary glucose rise.
Instead, I focus on sustainable dietary changes, appropriate activity, medication safety and individualised treatment goals.
For someone experiencing recurrent hypoglycaemia, reducing low-glucose exposure may be more important than lowering HbA1c further.
For another patient with prolonged hyperglycaemia and little hypoglycaemia, improving overall glucose exposure may be the main priority.
The aim is not to treat a graph. It is to treat the person whose glucose patterns the graph represents.
Key Takeaways About Glucose Variability
- Glucose variability describes fluctuations in glucose concentrations over time.
- Two people with the same HbA1c can have very different glucose patterns.
- HbA1c does not show hypoglycaemia frequency or the duration of post-meal glucose excursions.
- CGM provides additional information through time in range, time below range, time above range and coefficient of variation.
- Hypoglycaemia prevention is an important treatment-safety priority.
- Glucose CV of 36% or less is a commonly used target for many people with diabetes, but it is not a universal safety threshold.
- Not every post-meal glucose rise is harmful.
- Rice, roti and fruit do not need to be eliminated automatically.
- Physical activity, balanced meals and medication review can help improve glucose patterns.
- CGM readings should be interpreted with awareness of sensor limitations.
- HbA1c and CGM metrics are complementary.
- Individualised diabetes care is more useful than pursuing a perfectly flat glucose line.
Consultation for Diabetes and Glucose Management in Dwarka, Delhi
If you have diabetes and experience frequent glucose fluctuations, unexplained low readings or difficulty achieving consistent glucose control, a medical review may help identify the underlying pattern.
Dr. Pankaj Kumar, General & Lifestyle Physician, provides diabetes consultations, medication review, lifestyle guidance and interpretation of glucose-monitoring reports in Dwarka, Sector 6, New Delhi.
Assessment may include reviewing HbA1c, fasting and post-meal glucose, CGM data when available, medication use, dietary patterns and relevant metabolic risk factors.
The treatment plan is individualised according to the patient's medical condition and goals.
References
- American Diabetes Association Professional Practice Committee. Standards of Care in Diabetes. https://professional.diabetes.org/standards-of-care
- Battelino T, et al. Clinical Targets for Continuous Glucose Monitoring Data Interpretation: Recommendations From the International Consensus on Time in Range. Diabetes Care. 2019;42(8):1593–1603. https://doi.org/10.2337/dci19-0028
- Bergenstal RM, et al. Glucose Management Indicator (GMI): A New Term for Estimating A1C From Continuous Glucose Monitoring. Diabetes Care. 2018;41(11):2275–2280. https://doi.org/10.2337/dc18-1581
- Beck RW, et al. Validation of Time in Range as an Outcome Measure for Diabetes Clinical Trials. Diabetes Care. 2019;42(3):400–405. https://doi.org/10.2337/dc18-1444
- World Health Organization. WHO Guidelines on Physical Activity and Sedentary Behaviour. 2020. https://www.who.int/publications/i/item/9789240015128
Medical disclaimer: This article is intended for general patient education and does not replace individual medical advice. Glucose targets and treatment decisions should be personalised. Patients using insulin or other medicines associated with hypoglycaemia should not change medication doses without appropriate clinical guidance.
Written by Dr. Pankaj Kumar , General & Lifestyle Physician, Dwarka, New Delhi