















- 19th November 2026
Table of Contents
- What Is Time in Range for Diabetes?
- What Is a Good Time in Range for Diabetes?
- Understanding the Five CGM Glucose Zones
- What Does 70% Time in Range Actually Mean?
- What Is HbA1c and What Does It Measure?
- Why HbA1c Alone May Not Tell the Complete Story
- Time in Range vs HbA1c: What Is the Difference?
- Can Two People Have the Same HbA1c but Different Time in Range?
- Example: Two Patients With Similar HbA1c but Different CGM Profiles
- Why Hypoglycaemia Makes Time in Range Clinically Important
- Why Time in Range Does Not Replace HbA1c
- How Many Days of CGM Data Are Needed?
- Time in Range for Diabetes: Why the Complete CGM Report Matters
- What Is an Ambulatory Glucose Profile (AGP)?
- How to Read a CGM Report Step by Step
- Five Important Measurements in a CGM Report
- What Is Glucose Variability in Diabetes?
- What Is the Coefficient of Variation in CGM?
- Example: Stable Glucose vs Highly Variable Glucose
- What Is the Glucose Management Indicator (GMI)?
- Why Can GMI and HbA1c Be Different?
- Example: HbA1c Is 8.2% but GMI Is 7.1%
- Can Time in Range Predict Diabetes Complications?
- Does 70% Time in Range Equal an HbA1c of 7%?
- Why Post-Meal Glucose Spikes Matter
- Why Indian Breakfasts May Produce Different CGM Patterns
- How Common Indian Foods May Affect Glucose Patterns
- Can Walking After Meals Improve Time in Range?
- Can Stress and Poor Sleep Affect Time in Range?
- What Is the Dawn Phenomenon?
- Time in Range for Type 1 Diabetes
- Time in Range for Type 2 Diabetes
- Should Everyone With Type 2 Diabetes Use CGM?
- Common Mistakes When Interpreting CGM Data
- Time in Range for Diabetes: Should Everyone Have the Same Target?
- Time in Range Targets for Different Patient Groups
- Time in Range for Older Adults With Diabetes
- Why Time Below Range May Be More Important Than TIR in Some Patients
- Time in Range During Pregnancy: Why the Targets Are Different
- Time in Range in Patients With Chronic Kidney Disease
- When Can CGM Be More Informative Than HbA1c?
- How Time in Range Can Help Guide Diabetes Treatment
- Common CGM Patterns and Their Possible Clinical Implications
- Can Improving Time in Range Reduce Diabetes Complications?
- Is a 10% Improvement in Time in Range Clinically Meaningful?
- Can Time in Range Be Used to Evaluate Diet Changes?
- Why a Perfectly Flat Glucose Graph Is Not the Goal
- How Often Should a Person With Diabetes Review Time in Range?
- Can CGM Replace Finger-Prick Glucose Testing Completely?
- Is CGM Useful for People With Prediabetes?
- What Should Patients Look for Before Buying a CGM Device?
- Seven Common Mistakes When Using Time in Range for Diabetes
- 1. Looking Only at the TIR Percentage
- 2. Comparing TIR With Another Person's Results
- 3. Treating GMI as Identical to HbA1c
- 4. Making Medication Changes After a Single Reading
- 5. Ignoring Sensor Accuracy
- 6. Eliminating Foods After One Glucose Spike
- 7. Assuming HbA1c Is No Longer Necessary
- Frequently Asked Questions About Time in Range for Diabetes
- 1. What is Time in Range for Diabetes?
- 2. Is Time in Range better than HbA1c?
- 3. Is 70% Time in Range good?
- 4. What does 80% Time in Range mean?
- 5. Does 70% Time in Range equal HbA1c of 7%?
- 6. Can HbA1c be normal while glucose spikes occur?
- 7. Can Time in Range identify night-time hypoglycaemia?
- 8. Is CGM useful for type 2 diabetes without insulin?
- 9. What is a good glucose variability percentage?
- 10. What is the difference between GMI and HbA1c?
- 11. How many days of CGM data are needed?
- 12. Does a higher Time in Range always mean better control?
- 13. Can walking after meals improve Time in Range?
- 14. Should people with prediabetes use CGM?
- 15. Can Time in Range replace blood sugar tests?
- 16. Can Time in Range predict diabetes complications?
- 17. What is the ideal Time in Range for older adults?
- 18. What is the Time in Range target during pregnancy?
- My Clinical Approach to Time in Range and HbA1c
- Key Takeaways: Time in Range for Diabetes
- Diabetes and CGM Consultation in Dwarka, Delhi
- Scientific References and Clinical Guidelines
- About the Author
- Medical Disclaimer
Time in Range for Diabetes: Is It More Useful Than HbA1c Alone?
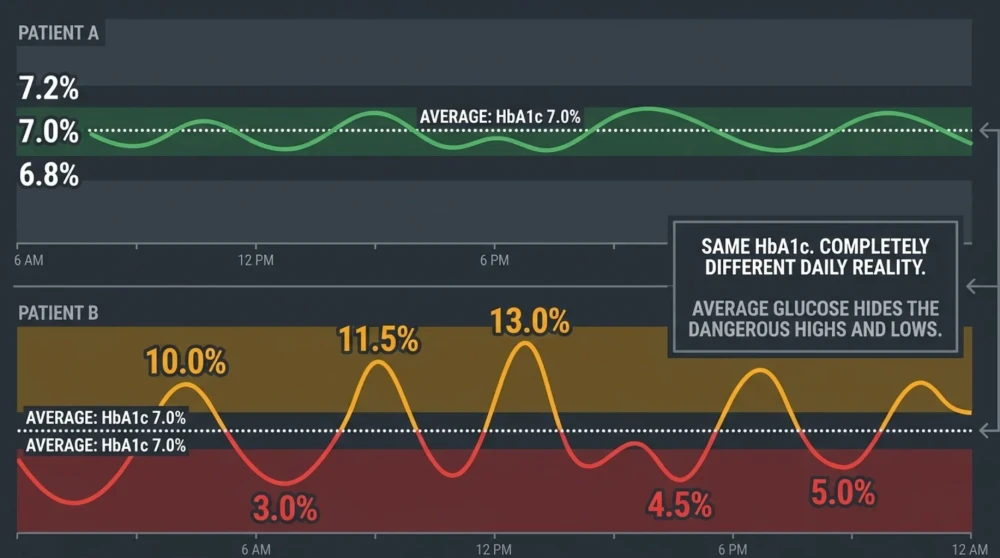
Two people living with diabetes visit their doctor for a routine follow-up. Both have an HbA1c of 7.0%, which appears reasonably controlled for many adults with diabetes.
However, their daily glucose patterns are very different.
The first person has relatively stable glucose readings throughout the day. Most values remain between 90 and 170 mg/dL, with only occasional elevations after meals.
The second person experiences repeated glucose spikes above 250 mg/dL after meals, followed by episodes of low glucose during the night.
Despite these differences, both may have a similar HbA1c because HbA1c reflects average glucose exposure rather than the precise pattern of highs and lows.
This is where Time in Range for Diabetes becomes useful.
Time in Range, commonly abbreviated as TIR, measures the percentage of time glucose remains within a defined target range. It is usually calculated using continuous glucose monitoring (CGM).
Unlike HbA1c, which provides an overall picture of glycaemic exposure over approximately two to three months, CGM can reveal when glucose rises, how long it remains elevated, and whether potentially dangerous low-glucose episodes occur.
However, this does not mean that HbA1c has become outdated or unnecessary.
Both measurements provide valuable but different information. Understanding their strengths and limitations can help patients and clinicians make better diabetes-management decisions.
What Is Time in Range for Diabetes?
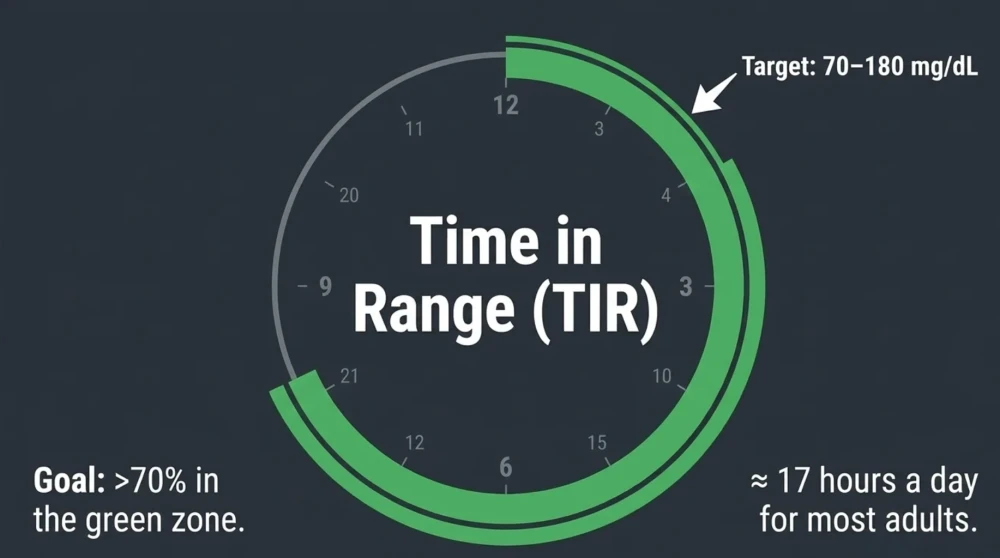
Time in Range for Diabetes is the percentage of time a person's glucose readings remain within a specified target interval.
For most nonpregnant adults with type 1 or type 2 diabetes, the commonly recommended target range is 70–180 mg/dL.
For example, if a CGM device records glucose readings over 24 hours and the values remain between 70 and 180 mg/dL for 18 hours, the Time in Range is 75%.
The remaining six hours are spent either above or below the target range.
However, TIR alone does not tell us whether those six hours represent mildly elevated glucose, severe hyperglycaemia or potentially dangerous hypoglycaemia.
Therefore, a complete CGM assessment must also examine Time Above Range and Time Below Range.
What Is a Good Time in Range for Diabetes?
The American Diabetes Association's 2026 Standards of Care recommend a Time in Range goal above 70% for many nonpregnant adults using CGM.
This means spending more than approximately 16 hours and 48 minutes each day within the glucose range of 70–180 mg/dL.
However, achieving this target should not come at the expense of frequent or severe hypoglycaemia.
For most adults, the recommended Time Below Range is less than 4% below 70 mg/dL and less than 1% below 54 mg/dL.
Targets may be less stringent for older adults with frailty, substantial comorbidities or increased hypoglycaemia risk.
Understanding the Five CGM Glucose Zones
A CGM report commonly divides glucose readings into five categories.
These categories help distinguish glucose values within the target range from mild or severe excursions above and below it.
| CGM Category | Glucose Level | Target for Most Adults |
|---|---|---|
| Very high glucose | Above 250 mg/dL | Less than 5% of the time |
| High glucose | Above 180 mg/dL | Less than 25% of the time, including readings above 250 mg/dL |
| Time in Range | 70–180 mg/dL | More than 70% |
| Low glucose | Below 70 mg/dL | Less than 4% of the time, including readings below 54 mg/dL |
| Very low glucose | Below 54 mg/dL | Less than 1% of the time |
These categories overlap by design: the time above 250 mg/dL is included within total time above 180 mg/dL, and time below 54 mg/dL is included within total time below 70 mg/dL.
The goals apply to many nonpregnant adults with diabetes. Different glucose ranges and targets are used during pregnancy and in selected high-risk populations.
What Does 70% Time in Range Actually Mean?
A 70% Time in Range means that approximately seven out of every ten glucose readings fall within the target range.
Because CGM records glucose frequently throughout the day and night, this can also be expressed as the approximate amount of time spent within range.
Time in Range Percentage Converted Into Hours
| Time in Range | Approximate Time per Day | Interpretation |
|---|---|---|
| 50% | 12 hours | Below the usual target for most adults; may be appropriate for selected high-risk older adults |
| 60% | 14 hours 24 minutes | Below the usual target for most adults |
| 70% | 16 hours 48 minutes | Common benchmark for many nonpregnant adults |
| 80% | 19 hours 12 minutes | Above the usual target if hypoglycaemia remains minimal |
| 90% | 21 hours 36 minutes | High TIR, but low-glucose exposure must still be checked |
Importantly, a higher TIR is not automatically better if it is achieved through excessive medication that causes recurrent hypoglycaemia.
For example, a person with 85% TIR but repeated glucose readings below 54 mg/dL may require more urgent treatment review than someone with 72% TIR and almost no hypoglycaemia.
What Is HbA1c and What Does It Measure?
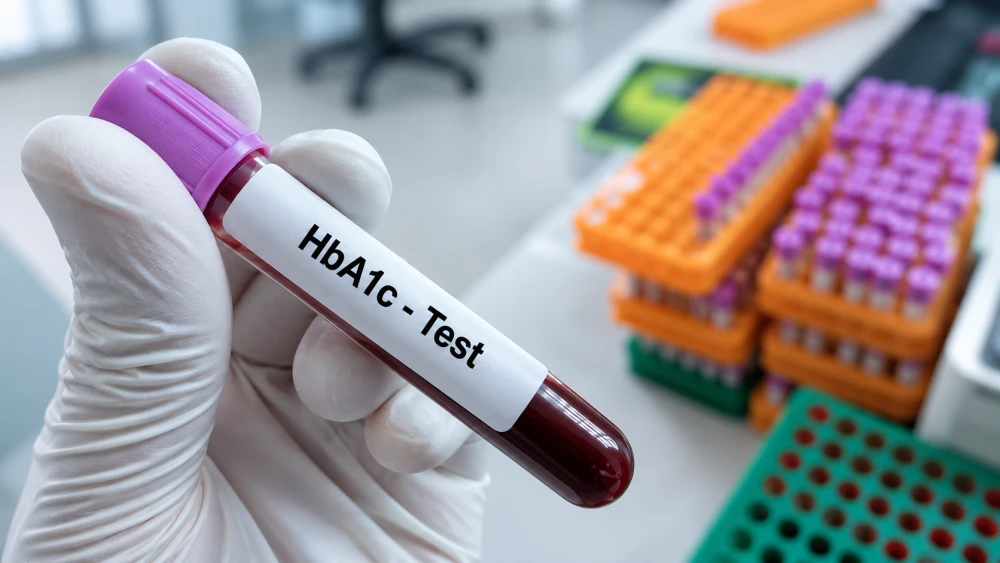
HbA1c, also called glycated haemoglobin, measures the proportion of haemoglobin that has glucose attached to it.
Because red blood cells circulate for approximately 120 days, HbA1c reflects glucose exposure over roughly the previous two to three months, with greater influence from more recent weeks.
HbA1c has been extensively studied and is associated with the risk of long-term diabetes complications.
For many nonpregnant adults with diabetes, an HbA1c target below 7% is appropriate when it can be achieved without significant hypoglycaemia or excessive treatment burden.
However, targets should be individualised according to age, diabetes duration, comorbidities, hypoglycaemia risk and other factors.
Why HbA1c Alone May Not Tell the Complete Story
HbA1c is valuable because it provides a relatively stable assessment of longer-term glucose exposure.
However, it has important limitations.
First, HbA1c does not reveal the timing of glucose elevations.
A patient may experience significant post-meal glucose spikes while maintaining an HbA1c near the treatment target.
Second, HbA1c does not directly measure hypoglycaemia.
Repeated low-glucose episodes may be masked by periods of hyperglycaemia.
Third, HbA1c does not quantify glucose variability.
Two patients with similar average glucose may have substantially different fluctuations throughout the day.
Finally, HbA1c can be misleading in certain conditions that affect red blood cell turnover or haemoglobin measurement.
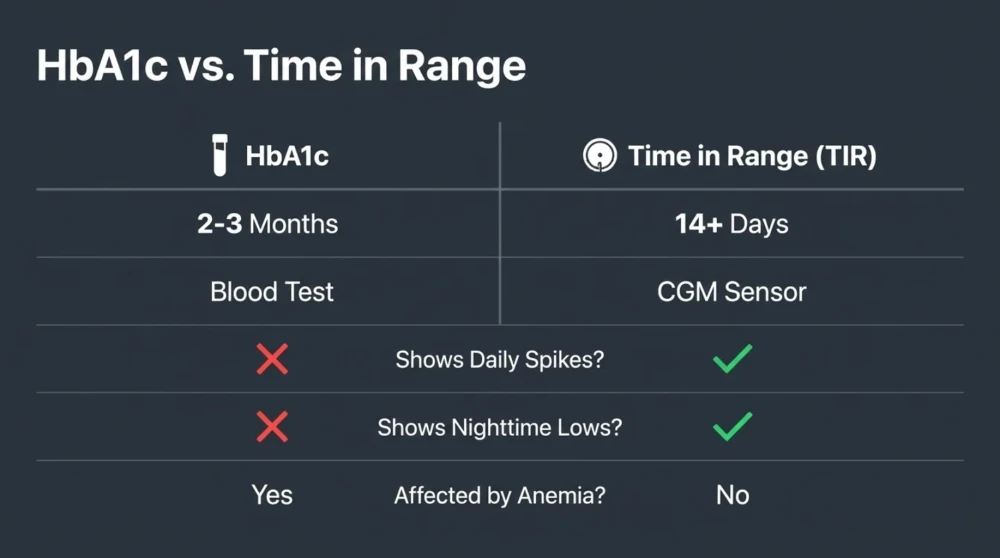
Time in Range vs HbA1c: What Is the Difference?
| Feature | HbA1c | Time in Range |
|---|---|---|
| Measurement | Longer-term glycaemic exposure | Percentage of monitored time within a glucose target |
| Typical assessment period | Approximately 2–3 months | Often 10–14 days or longer |
| Measurement method | Laboratory or validated point-of-care blood test | Continuous glucose monitoring |
| Post-meal spikes | Does not show individual spikes | Can reveal their timing and duration |
| Night-time hypoglycaemia | Cannot identify episodes | Can identify suspected episodes and patterns |
| Glucose variability | Not directly measured | Assessed using the full CGM report, including coefficient of variation |
| Influence of red blood cell disorders | May be inaccurate | Not dependent on haemoglobin glycation |
| Major limitation | Conceals daily highs and lows | Requires CGM; shorter monitoring periods may not represent long-term patterns |
Can Two People Have the Same HbA1c but Different Time in Range?
Yes, and this is one of the clearest examples of why CGM adds useful clinical information.
Consider two hypothetical patients with type 2 diabetes who both have an HbA1c of 7.0%.
Patient A has relatively stable glucose readings, with most values remaining between 90 and 175 mg/dL.
Patient B experiences substantial post-meal hyperglycaemia and occasional overnight hypoglycaemia.
Although their HbA1c values are identical, their glucose profiles are not.
Patient B may require closer evaluation of medication timing, meal patterns and hypoglycaemia risk.
However, it is important to remember that TIR itself is only one component of the CGM report. Time Below Range, Time Above Range and glucose variability are also necessary to understand the differences.
Example: Two Patients With Similar HbA1c but Different CGM Profiles
| Measurement | Patient A | Patient B |
|---|---|---|
| HbA1c | 7.0% | 7.0% |
| Time in Range | 82% | 61% |
| Time Above Range | 17% | 31% |
| Time Below Range | 1% | 8% |
| Main Concern | Relatively stable glucose profile | Frequent excursions and excessive hypoglycaemia |
These are illustrative profiles, not actual patient data. Identical laboratory HbA1c values do not require identical CGM-derived average glucose or identical TIR.
In this example, Patient B's 8% Time Below Range represents approximately one hour and 55 minutes per day below 70 mg/dL.
That is substantially above the recommended hypoglycaemia exposure for most adults.
Simply looking at the HbA1c value would fail to identify this important safety concern.
Why Hypoglycaemia Makes Time in Range Clinically Important
Hypoglycaemia is particularly important in people using insulin or medications such as sulfonylureas.
Symptoms may include sweating, trembling, palpitations, hunger, dizziness, confusion or weakness.
However, some patients develop impaired awareness of hypoglycaemia and may experience low glucose without typical warning symptoms.
Night-time hypoglycaemia can also go unnoticed.
HbA1c cannot identify when these episodes occur.
CGM can provide alerts and reveal patterns of low sensor glucose, helping patients and clinicians review treatment safety.
However, CGM readings can sometimes be inaccurate, particularly during rapid glucose changes or when pressure is applied to a sensor during sleep.
Unexpected or symptom-inconsistent readings should be checked using a finger-stick glucose measurement when appropriate.
Why Time in Range Does Not Replace HbA1c
Despite its advantages, Time in Range has limitations.
First, CGM measures glucose in interstitial fluid rather than directly measuring blood glucose.
Second, sensor accuracy can vary according to device performance, physiological conditions and the rate of glucose change.
Third, a two-week CGM report may not represent the patient's usual glucose pattern over several months.
For example, a person may have unusually good readings during a short period of strict dietary control, while their longer-term HbA1c remains elevated.
Conversely, a recent medication change may improve CGM readings before HbA1c has had sufficient time to reflect the improvement.
Therefore, differences between HbA1c and CGM should be interpreted rather than assuming that one measurement is necessarily wrong.
How Many Days of CGM Data Are Needed?
For pattern assessment, a 14-day CGM report with at least 70% active sensor data is commonly recommended.
This provides a useful sample of glucose patterns across weekdays, weekends, meals, activity and sleep.
However, longer monitoring may be necessary when glucose patterns are highly variable or when the patient has recently changed medication, diet or activity.
Data quality matters as much as the duration of monitoring.
A report with substantial missing data may not accurately represent the patient's true glucose exposure.
Time in Range for Diabetes: Why the Complete CGM Report Matters
When a person with diabetes begins using continuous glucose monitoring, the most noticeable feature is often the glucose graph.
Instead of seeing only a fasting glucose value or a two-hour post-meal reading, the patient can observe glucose changes throughout the day and night.
This additional information can be useful, but it can also become confusing.
For example, a person may notice that glucose rises after eating rice, falls after walking, increases during illness or changes overnight.
Not every rise represents a medical problem, and not every glucose fluctuation requires an immediate intervention.
The objective is to identify clinically meaningful patterns rather than react to individual sensor readings.
Time in Range for Diabetes is most useful when interpreted alongside Time Above Range, Time Below Range, average glucose, glucose variability and the patient's treatment history.
What Is an Ambulatory Glucose Profile (AGP)?
The Ambulatory Glucose Profile, commonly called AGP, is a standardised report used to summarise CGM data.
It combines glucose readings collected over multiple days into a visual representation of typical glucose patterns across a 24-hour period.
The report commonly includes average glucose, Glucose Management Indicator, Time in Range, Time Above Range, Time Below Range and glucose variability.
It also displays a graph showing the median glucose level and the distribution of readings at different times of day.
This makes it easier to recognise recurring patterns, such as elevated glucose after breakfast or low glucose during the early morning hours.
However, the AGP represents a summary of the monitoring period. It does not establish why a glucose abnormality occurred.
Food intake, medication timing, physical activity, sleep, illness and sensor performance must be considered during interpretation.
How to Read a CGM Report Step by Step
A practical approach begins with data quality and patient safety.
Before interpreting glucose patterns, the clinician should confirm that the report contains sufficient sensor data.
For many routine assessments, approximately 14 days of CGM data with at least 70% active sensor readings provides a useful starting point.
The next priority is identifying hypoglycaemia.
This is particularly important in patients using insulin or medications associated with low glucose.
Once low-glucose exposure has been reviewed, the clinician can examine Time in Range, hyperglycaemia and glucose variability.
Finally, the glucose patterns should be compared with the patient's meals, medications, activity and symptoms.
Five Important Measurements in a CGM Report
| Measurement | What It Shows | Why It Matters |
|---|---|---|
| Time in Range (TIR) | Percentage of time between 70 and 180 mg/dL | Overall glucose control during the monitoring period |
| Time Above Range (TAR) | Time spent above 180 mg/dL | Identifies excess hyperglycaemia exposure |
| Time Below Range (TBR) | Time spent below 70 mg/dL | Highlights hypoglycaemia risk |
| Glucose Management Indicator (GMI) | Estimated HbA1c-like value calculated from CGM mean glucose | Provides a summary of recent CGM-derived glucose exposure |
| Coefficient of Variation (CV) | Relative glucose variability | Helps identify unstable glucose patterns |
What Is Glucose Variability in Diabetes?
Glucose variability describes how much glucose levels fluctuate over time.
Two patients can have similar average glucose but very different variability.
For example, one person may remain between 100 and 180 mg/dL for most of the day.
Another may alternate between 60 and 250 mg/dL.
Their average glucose could be similar, but the second person experiences substantially greater fluctuations.
High glucose variability may be associated with more frequent hypoglycaemia and can make diabetes management more challenging.
However, the relationship between glucose variability and long-term complications is complex, and variability should not be presented as an independently proven cause of every diabetes complication.
What Is the Coefficient of Variation in CGM?
The coefficient of variation, or CV, expresses glucose variability relative to average glucose.
It is calculated by dividing the standard deviation of glucose readings by the mean glucose and multiplying by 100.
For many adults with diabetes, a glucose CV of 36% or lower is commonly used as a benchmark for more stable glucose patterns.
A CV above 36% suggests increased glucose variability.
However, a low CV does not automatically indicate good diabetes control.
For example, a person whose glucose remains consistently around 220 mg/dL may have relatively low variability but excessive hyperglycaemia.
Therefore, CV must be interpreted alongside TIR, TAR and TBR.
Example: Stable Glucose vs Highly Variable Glucose
| Parameter | Patient A | Patient B |
|---|---|---|
| Average glucose | 150 mg/dL | 150 mg/dL |
| Glucose CV | 22% | 42% |
| Typical pattern | Relatively stable glucose | Frequent glucose fluctuations |
| Clinical concern | Assess overall target achievement | Evaluate possible hypoglycaemia and recurring excursions |
These values are illustrative and do not represent actual patient data.
What Is the Glucose Management Indicator (GMI)?
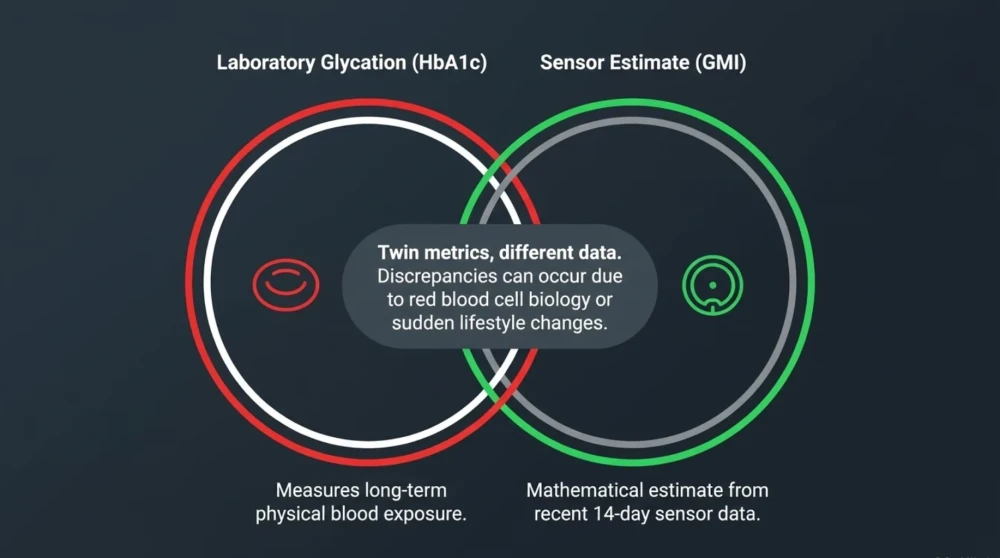
Glucose Management Indicator, or GMI, is a value calculated from average CGM glucose.
It is expressed as a percentage, making it resemble HbA1c.
However, GMI and laboratory HbA1c are not identical measurements.
GMI estimates an HbA1c-like value from recent sensor glucose data, whereas laboratory HbA1c measures haemoglobin glycation.
Consequently, the two values may differ even when both measurements are technically accurate.
Why Can GMI and HbA1c Be Different?
Several factors can contribute to differences between GMI and laboratory HbA1c.
First, they may represent different time periods.
A 14-day CGM report reflects recent glucose exposure, while HbA1c reflects a longer period.
Second, HbA1c is affected by red blood cell lifespan and certain medical conditions.
Iron deficiency, haemoglobin variants, recent blood loss, transfusion and conditions affecting red blood cell turnover may influence HbA1c interpretation.
Third, sensor measurement errors or insufficient CGM data can affect GMI.
Therefore, a difference between GMI and HbA1c should prompt clinical interpretation rather than automatic adjustment of treatment.
Example: HbA1c Is 8.2% but GMI Is 7.1%
Consider a hypothetical patient whose laboratory HbA1c is 8.2%, while the recent CGM report shows a GMI of 7.1%.
One possible explanation is that glucose control has improved recently following changes in medication, diet or physical activity.
Because HbA1c reflects a longer period, it may remain elevated despite improved recent readings.
However, this difference could also reflect biological or measurement-related factors.
The clinician should review the CGM period, laboratory results, clinical history and possible conditions affecting HbA1c.
GMI should not automatically replace laboratory HbA1c for diagnosis or long-term assessment.
Can Time in Range Predict Diabetes Complications?
Research has found associations between lower Time in Range and increased risk of certain diabetes complications.
Observational studies have linked lower TIR with diabetic retinopathy, albuminuria and other microvascular outcomes.
However, an association does not establish that improving TIR by a particular percentage will necessarily reduce complications by a specific amount.
HbA1c has a much longer history of evidence from major clinical trials demonstrating the benefits of improved glycaemic control.
TIR is therefore a useful complementary marker, but its long-term outcome evidence should not be presented as identical to that of HbA1c.
Does 70% Time in Range Equal an HbA1c of 7%?
Not exactly.
Population-level studies have found an approximate relationship between TIR and HbA1c.
A TIR around 70% often corresponds to an HbA1c near 7%, but the relationship varies substantially between individuals.
Differences in glucose variability, red blood cell biology, sensor performance and the period of measurement can influence the relationship.
Therefore, TIR should not be converted into HbA1c using a fixed formula for individual treatment decisions.
Why Post-Meal Glucose Spikes Matter
After eating a meal containing carbohydrates, blood glucose normally rises.
The size and duration of this rise depend on several factors, including carbohydrate quantity, food composition, insulin availability, medication, activity and individual physiology.
In people with diabetes, post-meal glucose may rise higher or remain elevated longer.
HbA1c cannot show which meals produce the largest excursions.
CGM can reveal recurring patterns after breakfast, lunch or dinner.
However, not every brief rise above 180 mg/dL requires medication adjustment.
The clinical significance depends on the duration, frequency, overall glucose exposure and individual treatment goals.
Why Indian Breakfasts May Produce Different CGM Patterns
Consider a person with type 2 diabetes who alternates between several common Indian breakfasts.
On one day, breakfast consists of white bread, jam and sweetened tea.
On another day, breakfast includes vegetable besan chilla with curd.
On a third day, breakfast consists of poha prepared with vegetables and peanuts.
The glucose response may differ between these meals because of variations in carbohydrate quantity, protein, fat, fibre and portion size.
However, it would be inaccurate to claim that one meal will always produce a particular glucose response in every person.
CGM can help identify individual patterns, but the results should be interpreted in the context of the overall diet.
How Common Indian Foods May Affect Glucose Patterns
| Food or Meal | Factors Affecting Glucose Response | Practical Consideration |
|---|---|---|
| White rice | Portion size, variety and accompanying foods | Pair with dal, vegetables and protein |
| Roti | Flour type, size and number of rotis | Adjust portion and overall meal composition |
| Poha | Portion size and added ingredients | Include vegetables and a suitable protein source |
| Idli with sambar | Number of idlis and sambar composition | Evaluate the complete meal rather than the idli alone |
| Dal and vegetables | Carbohydrate, protein and fibre content | Useful components of a balanced meal |
| Sweetened tea and biscuits | Added sugar and refined carbohydrate content | Consider reducing added sugar and improving snack quality |
Can Walking After Meals Improve Time in Range?
Light to moderate physical activity after meals may reduce postprandial glucose excursions in some people with diabetes.
Walking increases glucose uptake by working muscles and can contribute to better glucose regulation.
For example, a short walk after lunch or dinner may reduce the magnitude or duration of a glucose rise.
However, the response varies according to medication, meal composition, exercise intensity and individual physiology.
Patients using insulin or sulfonylureas should consider hypoglycaemia risk when increasing physical activity.
CGM may help identify how activity influences individual glucose patterns.
Can Stress and Poor Sleep Affect Time in Range?
Stress, illness and inadequate sleep can influence glucose regulation through changes in hormones, behaviour and insulin sensitivity.
For example, a person may notice higher morning glucose after a night of poor sleep.
However, a single CGM pattern cannot establish that sleep deprivation or stress caused the elevation.
Other factors, including food intake, medication timing, illness and the dawn phenomenon, may contribute.
CGM can identify patterns that deserve further evaluation, but it cannot independently determine their cause.
What Is the Dawn Phenomenon?
The dawn phenomenon refers to an early-morning rise in glucose associated with normal hormonal changes and increased hepatic glucose production.
It may occur in people with diabetes even when they have not eaten during the night.
CGM can help distinguish a gradual early-morning rise from other overnight patterns.
However, clinicians should avoid assuming that every elevated fasting glucose value is caused by the dawn phenomenon.
Overnight food intake, inadequate medication coverage, illness and other factors may also contribute.
Time in Range for Type 1 Diabetes
CGM is particularly useful in type 1 diabetes because glucose can fluctuate substantially with insulin dosing, carbohydrate intake, physical activity and illness.
It can help identify nocturnal hypoglycaemia, post-meal hyperglycaemia and recurring patterns related to insulin administration.
CGM is also an important component of automated insulin delivery systems.
However, patients still require education about insulin use, carbohydrate estimation, hypoglycaemia management and sensor limitations.
Time in Range for Type 2 Diabetes
In type 2 diabetes, CGM may be especially useful for patients using insulin, those experiencing suspected hypoglycaemia, or those whose glucose patterns are not adequately explained by HbA1c and finger-stick measurements.
It may also help selected patients understand the effects of meals, exercise and treatment changes.
However, the clinical benefit of CGM depends on how the information is used.
Simply wearing a sensor does not guarantee improved glucose control.
Structured interpretation and appropriate treatment decisions are important.
Should Everyone With Type 2 Diabetes Use CGM?
Not necessarily.
CGM can be valuable for many people with type 2 diabetes, but the need for continuous or intermittent monitoring should be individualised.
Patients using insulin, those with recurrent hypoglycaemia and those requiring treatment optimisation may derive particular benefit.
For others, laboratory HbA1c, appropriate self-monitoring of blood glucose and clinical assessment may provide sufficient information.
Cost, access, treatment complexity, patient preferences and the ability to act on CGM information should all influence the decision.
Common Mistakes When Interpreting CGM Data
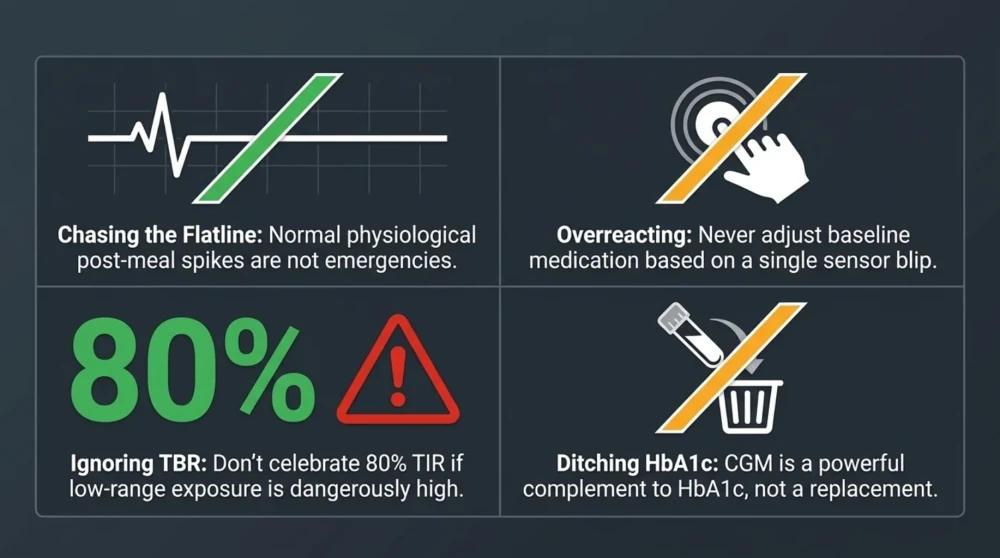
One common mistake is focusing exclusively on the Time in Range percentage while ignoring hypoglycaemia.
Another is interpreting a single glucose spike as evidence that a particular food must be permanently avoided.
Patients may also compare their CGM results with those of friends or family members without considering differences in diabetes type, medication and individual targets.
Some people become anxious when they see normal glucose fluctuations and attempt to keep every reading within an unnecessarily narrow range.
Others may change medication doses repeatedly in response to individual sensor values without considering the broader pattern.
These approaches can lead to confusion and potentially unsafe decisions.
The purpose of CGM is to improve understanding and support informed treatment, not to eliminate every physiological glucose fluctuation.
Time in Range for Diabetes: Should Everyone Have the Same Target?
One of the most important principles in diabetes management is that glucose targets should be individualised.
For many nonpregnant adults with type 1 or type 2 diabetes, spending more than 70% of the time between 70 and 180 mg/dL is a reasonable goal.
However, this target is not appropriate for every patient.
A healthy 35-year-old person with recently diagnosed type 2 diabetes may have different treatment goals from an 82-year-old person with frailty, recurrent hypoglycaemia and multiple medical conditions.
Similarly, glucose targets during pregnancy differ from those used in routine adult diabetes management.
Time in Range for Diabetes should therefore be interpreted according to the patient's age, treatment, hypoglycaemia risk, comorbidities and personal circumstances.
The objective is not simply to achieve the highest possible TIR. It is to obtain meaningful glycaemic control without causing avoidable harm.
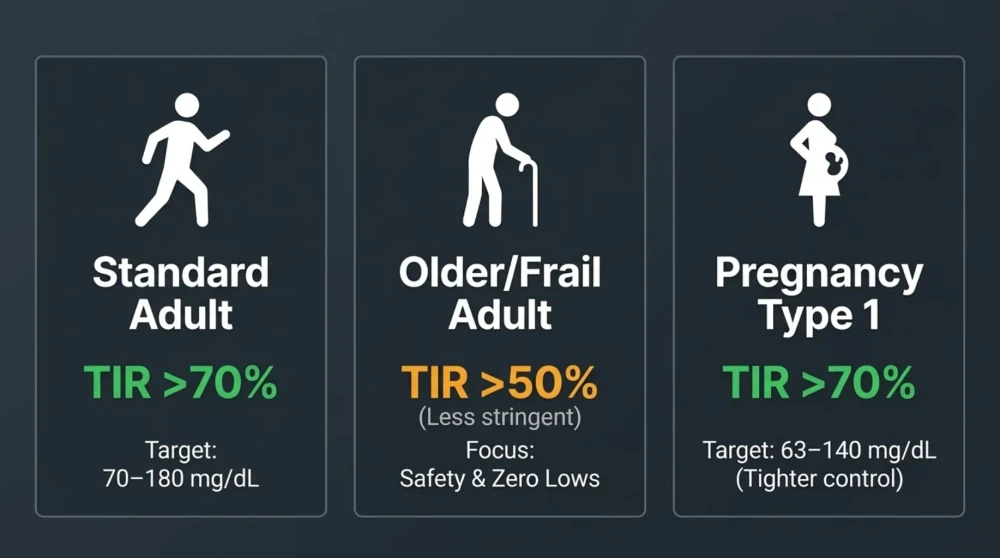
Time in Range Targets for Different Patient Groups
International consensus recommendations and contemporary diabetes guidelines recognise that CGM targets should be adapted for different clinical populations.
| Patient Group | Common TIR Target | Important Consideration |
|---|---|---|
| Most nonpregnant adults with type 1 or type 2 diabetes | More than 70% between 70–180 mg/dL | Minimise time below 70 mg/dL and especially below 54 mg/dL |
| Older adults with frailty or high hypoglycaemia risk | A less stringent goal, sometimes above 50% between 70–180 mg/dL | Avoiding hypoglycaemia may take priority over tighter glucose control |
| Pregnancy with type 1 diabetes | More than 70% between 63–140 mg/dL | Pregnancy-specific targets and specialist management are required |
| Pregnancy with type 2 diabetes or gestational diabetes | Pregnancy-specific glucose goals; no universally established CGM TIR percentage for all patients | Use established pregnancy glucose targets and individualised specialist guidance |
These are general benchmarks rather than mandatory targets. Individual clinical circumstances may justify different goals.
Time in Range for Older Adults With Diabetes
Older adults often require a different approach to glycaemic management.
Some remain physically active and independent, with few additional medical conditions.
Others may have frailty, cognitive impairment, kidney disease, cardiovascular disease or a history of severe hypoglycaemia.
These differences influence the risks and benefits of intensive glucose lowering.
For an older patient taking insulin or a sulfonylurea, repeated hypoglycaemia may increase the risk of falls, confusion and other adverse events.
In such circumstances, treatment simplification and reducing low-glucose exposure may be more important than achieving a TIR above 70%.
However, age alone should not determine treatment intensity.
A healthy older adult may still benefit from standard glycaemic targets if they can be achieved safely.
Why Time Below Range May Be More Important Than TIR in Some Patients
Consider a hypothetical 76-year-old woman with type 2 diabetes who uses insulin.
Her CGM report shows a Time in Range of 74%, which appears satisfactory.
However, 7% of her readings are below 70 mg/dL, including episodes during sleep.
Despite meeting the usual TIR target, she has excessive hypoglycaemia exposure.
Her treatment therefore requires review.
The clinician may need to assess insulin dosing, meal patterns, kidney function, physical activity and other factors.
In selected patients, reducing treatment intensity may improve safety even if the overall TIR percentage decreases slightly.
A good Time in Range result should never be used to overlook clinically important hypoglycaemia.
Time in Range During Pregnancy: Why the Targets Are Different
Pregnancy requires tighter glucose management because maternal glucose levels can influence fetal growth and pregnancy outcomes.
For pregnant women with type 1 diabetes, international CGM consensus recommendations use a target range of 63–140 mg/dL.
The commonly recommended goal is to spend more than 70% of the time within this pregnancy-specific range, with less than 4% below 63 mg/dL and less than 1% below 54 mg/dL.
These targets differ from the standard 70–180 mg/dL range used for most nonpregnant adults.
However, the evidence for specific CGM TIR percentages is stronger in pregnancy with type 1 diabetes than in gestational diabetes or pregnancy with type 2 diabetes.
CGM should be interpreted alongside established fasting and post-meal pregnancy glucose targets.
Pregnancy-related treatment decisions require coordinated obstetric and diabetes care.
Time in Range in Patients With Chronic Kidney Disease
Chronic kidney disease can complicate glucose monitoring and diabetes treatment.
Advanced kidney disease may alter insulin requirements and increase susceptibility to hypoglycaemia.
In addition, anaemia, erythropoiesis-stimulating treatments and altered red blood cell survival may affect HbA1c reliability.
CGM can therefore provide useful information about glucose patterns in selected patients with kidney disease.
However, sensor performance and accuracy may vary in advanced kidney disease and during dialysis.
Unexpected readings should be interpreted cautiously and confirmed when clinically indicated.
There is no single TIR target appropriate for every person with diabetes and chronic kidney disease.
Targets should reflect kidney disease severity, treatment, hypoglycaemia risk and overall health.
When Can CGM Be More Informative Than HbA1c?
There are several clinical situations in which CGM may provide information that substantially improves treatment decisions.
One example is recurrent hypoglycaemia despite an apparently satisfactory HbA1c.
Another is suspected post-meal hyperglycaemia when fasting glucose readings are relatively well controlled.
CGM may also be useful when glucose patterns change after starting insulin, adjusting medication or modifying meal and activity routines.
In patients whose HbA1c may be unreliable because of altered red blood cell turnover, CGM can provide an additional assessment of glucose exposure.
However, the availability of CGM does not eliminate the need for laboratory evaluation, clinical examination or appropriate self-monitoring.
How Time in Range Can Help Guide Diabetes Treatment
CGM is most useful when the information leads to an appropriate clinical decision.
For example, repeated glucose elevations after dinner may prompt an assessment of meal composition, carbohydrate quantity, medication timing or insulin coverage.
Recurring overnight hypoglycaemia may require reviewing evening insulin doses, exercise patterns or other medications.
Persistent fasting hyperglycaemia may lead to evaluation of overnight glucose patterns and the adequacy of treatment.
However, these patterns do not identify the correct medication adjustment automatically.
Changes should be based on diabetes type, current treatment, symptoms and the overall clinical context.
Common CGM Patterns and Their Possible Clinical Implications
| CGM Pattern | Possible Explanation | What to Review |
|---|---|---|
| Repeated overnight lows | Medication effect, physical activity, reduced food intake or sensor compression | Confirm suspected lows and review medication safety |
| High glucose after breakfast | Meal composition, carbohydrate quantity or inadequate treatment coverage | Breakfast pattern and medication timing |
| Gradual early-morning rise | Dawn phenomenon or inadequate overnight treatment | Overnight trend and clinical context |
| Frequent daytime lows | Medication, missed meals or increased activity | Hypoglycaemia risk and treatment regimen |
| Persistently elevated glucose | Insufficient treatment, illness or other metabolic factors | Overall diabetes management and possible intercurrent illness |
These patterns are examples, not diagnostic rules. CGM data should be interpreted with the patient's medical history and treatment details.
Can Improving Time in Range Reduce Diabetes Complications?
Lower Time in Range has been associated with a higher prevalence or risk of certain diabetes complications in observational research.
Studies have reported relationships between TIR and outcomes such as diabetic retinopathy and kidney-related abnormalities.
However, these associations do not establish that every increase in TIR produces a predictable reduction in complications.
The evidence supporting HbA1c as a marker of long-term glycaemic exposure and microvascular risk is based on decades of clinical research, including major randomised trials.
By comparison, TIR is a newer clinical metric, and the evidence connecting specific TIR improvements to long-term outcomes continues to develop.
Therefore, TIR should be viewed as a valuable complementary measure rather than a complete replacement for HbA1c.
Is a 10% Improvement in Time in Range Clinically Meaningful?
A 10-percentage-point increase in TIR represents approximately two hours and 24 minutes more per day within the target glucose range.
For example, improving TIR from 55% to 65% indicates that a greater proportion of monitored glucose readings now fall between 70 and 180 mg/dL.
This may represent meaningful improvement in glucose management.
However, the benefit depends on what changed outside the target range.
An increase in TIR accompanied by reduced hyperglycaemia and minimal hypoglycaemia is generally encouraging.
In contrast, an apparent improvement that conceals increased low-glucose exposure requires closer evaluation.
Therefore, changes in TIR should always be interpreted alongside TBR, TAR and glucose variability.
Can Time in Range Be Used to Evaluate Diet Changes?
CGM may help people with diabetes understand how their usual meals influence glucose patterns.
For example, a patient may compare glucose responses after different breakfast combinations or observe whether walking after dinner changes the post-meal glucose profile.
However, the response to one meal on one day is not sufficient to establish a reliable conclusion.
Glucose levels are affected by previous meals, sleep, physical activity, medication, stress and other factors.
Repeated observations under reasonably comparable conditions are more informative.
Patients should also consider overall nutritional quality rather than choosing foods exclusively because they produce a smaller immediate glucose rise.
A nutritious meal containing fruit, legumes or whole grains may produce a measurable glucose increase without being an inappropriate choice.
Why a Perfectly Flat Glucose Graph Is Not the Goal
Some patients become concerned when their CGM graph shows any rise after eating.
However, glucose fluctuations are a normal physiological response to food intake, physical activity and hormonal changes.
The objective of diabetes management is not to maintain an entirely flat glucose line.
Instead, the aim is to reduce excessive hyperglycaemia, minimise hypoglycaemia and maintain glucose control appropriate to the individual.
Unnecessarily restrictive diets or repeated medication changes intended to eliminate every glucose fluctuation may create more problems than benefits.
How Often Should a Person With Diabetes Review Time in Range?
The appropriate frequency depends on diabetes type, treatment and the purpose of monitoring.
People using insulin or automated insulin delivery systems may benefit from regular CGM review.
Others may use intermittent CGM to assess treatment changes or identify glucose patterns.
For a structured assessment, approximately 14 days of data with sufficient sensor capture is often useful.
However, short monitoring periods may not reflect long-term glucose control in every patient.
Laboratory HbA1c remains useful for periodic assessment, commonly every three months when treatment is changing or glycaemic targets are not being met, and less frequently when control is stable and appropriate.
Can CGM Replace Finger-Prick Glucose Testing Completely?
Not always.
Many modern CGM systems are approved for treatment decisions without routine confirmatory finger-prick testing under specified conditions.
However, capillary blood glucose testing remains important when sensor readings do not match symptoms, when glucose is changing rapidly or when a sensor malfunction is suspected.
Some devices and clinical situations also require confirmation according to the manufacturer's instructions.
People using insulin should understand how to respond to suspected hypoglycaemia and how to manage diabetes safely when CGM data are unavailable.
Is CGM Useful for People With Prediabetes?
CGM can reveal glucose responses to meals and physical activity in people without diagnosed diabetes.
However, evidence is currently insufficient to recommend routine CGM use for every person with prediabetes.
There are no universally established TIR treatment targets for prediabetes equivalent to those used for people with diabetes.
Diagnosis and risk assessment should continue to rely on validated laboratory tests, including fasting plasma glucose, HbA1c and oral glucose tolerance testing when appropriate.
CGM should not be used to diagnose prediabetes or diabetes on its own.
What Should Patients Look for Before Buying a CGM Device?
Patients should consider whether the device is approved for their intended use, its accuracy, sensor wear duration, cost and compatibility with their smartphone or reader.
They should also consider whether the system provides glucose alerts and downloadable reports.
For patients with frequent hypoglycaemia, reliable alerts may be particularly important.
However, purchasing a CGM device without a clear plan for interpreting the information may provide limited benefit.
For many patients, the most valuable part of CGM is not the number of readings collected but the quality of decisions made using those readings.
Seven Common Mistakes When Using Time in Range for Diabetes
1. Looking Only at the TIR Percentage
A high TIR does not exclude clinically important hypoglycaemia. TBR and TAR must also be reviewed.
2. Comparing TIR With Another Person's Results
Glucose targets vary according to diabetes type, age, medication, pregnancy and comorbidities.
3. Treating GMI as Identical to HbA1c
GMI is calculated from recent CGM glucose data, whereas HbA1c measures haemoglobin glycation.
4. Making Medication Changes After a Single Reading
Individual readings may be affected by physiological fluctuations or sensor limitations. Treatment changes should follow an appropriate clinical plan.
5. Ignoring Sensor Accuracy
Unexpected readings, especially suspected hypoglycaemia that does not match symptoms, may require capillary glucose confirmation.
6. Eliminating Foods After One Glucose Spike
Meal responses vary, and dietary decisions should consider nutritional quality, portion size and repeated patterns.
7. Assuming HbA1c Is No Longer Necessary
HbA1c remains an important measure of longer-term glycaemic exposure and should be interpreted alongside CGM when appropriate.
Frequently Asked Questions About Time in Range for Diabetes
1. What is Time in Range for Diabetes?
Time in Range is the percentage of monitored time that glucose remains within a defined target interval, commonly 70–180 mg/dL for most nonpregnant adults with diabetes.
2. Is Time in Range better than HbA1c?
Neither measurement is universally better. TIR reveals daily glucose patterns and hypoglycaemia, while HbA1c reflects longer-term glucose exposure. Both can provide complementary information.
3. Is 70% Time in Range good?
A TIR above 70% is a common target for many nonpregnant adults with diabetes, provided that hypoglycaemia remains minimal.
4. What does 80% Time in Range mean?
It means glucose remains within the target range for approximately 19 hours and 12 minutes per day during the monitoring period.
5. Does 70% Time in Range equal HbA1c of 7%?
Not necessarily. These values are approximately related at the population level, but individual results can differ substantially.
6. Can HbA1c be normal while glucose spikes occur?
Yes. HbA1c reflects average glucose exposure and may not reveal significant post-meal excursions or periods of low glucose.
7. Can Time in Range identify night-time hypoglycaemia?
CGM can identify suspected overnight low-glucose patterns, although unexpected readings may require confirmation.
8. Is CGM useful for type 2 diabetes without insulin?
It may be useful in selected patients, particularly for understanding glucose patterns or assessing treatment changes. Routine use is not necessary for everyone.
9. What is a good glucose variability percentage?
A glucose coefficient of variation of 36% or lower is a commonly used benchmark, but it must be interpreted alongside average glucose and time spent above or below range.
10. What is the difference between GMI and HbA1c?
GMI is calculated from CGM mean glucose, while HbA1c measures the percentage of glycated haemoglobin in blood.
11. How many days of CGM data are needed?
Approximately 14 days with at least 70% active sensor data is commonly recommended for routine pattern assessment, although longer monitoring may be needed.
12. Does a higher Time in Range always mean better control?
Not necessarily. A high TIR accompanied by excessive hypoglycaemia may indicate unsafe treatment.
13. Can walking after meals improve Time in Range?
Post-meal physical activity may reduce glucose excursions in some people, but responses vary according to medication, meal composition and individual factors.
14. Should people with prediabetes use CGM?
Routine CGM is not currently established as necessary for everyone with prediabetes. Laboratory testing remains essential for diagnosis and risk assessment.
15. Can Time in Range replace blood sugar tests?
CGM can reduce the need for routine finger-prick testing in many users, but confirmatory blood glucose testing may still be required in specific circumstances.
16. Can Time in Range predict diabetes complications?
Lower TIR is associated with certain diabetes complications in research, but long-term outcome evidence is less extensive than the evidence supporting HbA1c.
17. What is the ideal Time in Range for older adults?
Targets should be individualised. Less stringent goals may be appropriate for older adults with frailty, substantial comorbidities or increased hypoglycaemia risk.
18. What is the Time in Range target during pregnancy?
For pregnancy with type 1 diabetes, a commonly recommended target is more than 70% between 63 and 140 mg/dL. Other pregnancy populations require individualised interpretation.
My Clinical Approach to Time in Range and HbA1c
When assessing diabetes control, I do not rely exclusively on a single HbA1c result.
HbA1c remains important because it provides information about longer-term glycaemic exposure and helps assess whether treatment goals are being achieved.
However, when a patient has unexplained glucose fluctuations, suspected hypoglycaemia or difficulty achieving treatment targets, CGM may provide additional clinically useful information.
I first examine whether the available CGM data are sufficient and reliable.
Next, I review Time Below Range because identifying potentially dangerous hypoglycaemia is an important safety priority.
I then assess Time in Range, Time Above Range, glucose variability and recurring patterns.
Finally, I interpret these findings alongside the patient's medication, dietary habits, physical activity, sleep and relevant medical conditions.
The purpose is not to achieve a perfect glucose graph.
It is to make diabetes treatment safer, more practical and more effective.
Key Takeaways: Time in Range for Diabetes
- Time in Range measures the percentage of monitored time glucose remains within a defined target range.
- For most nonpregnant adults with diabetes, the usual range is 70–180 mg/dL.
- A TIR above 70% is a common target, but goals should be individualised.
- Time Below Range is essential for identifying hypoglycaemia risk.
- HbA1c reflects longer-term glucose exposure but cannot show daily highs and lows.
- CGM reveals glucose patterns, including post-meal elevations and overnight changes.
- GMI and laboratory HbA1c may differ and should not be treated as interchangeable.
- Glucose variability adds information about the stability of glucose patterns.
- Pregnancy, frailty and substantial comorbidities may require different glucose targets.
- CGM is most valuable when its information supports appropriate clinical decisions.
- Time in Range complements rather than universally replaces HbA1c.
Diabetes and CGM Consultation in Dwarka, Delhi
Understanding diabetes requires more than reviewing fasting glucose and HbA1c values.
For selected patients, CGM interpretation can help identify recurring glucose patterns, treatment-related hypoglycaemia and opportunities for practical lifestyle changes.
Dr. Pankaj Kumar, General & Lifestyle Physician, provides consultations for type 2 diabetes, prediabetes, weight management and associated metabolic conditions.
Management may include review of laboratory reports, glucose-monitoring records, medications, nutrition and physical activity.
Clinic: Dr. Pankaj Kumar Medical & Lifestyle Clinic, Dwarka, New Delhi.
Scientific References and Clinical Guidelines
- American Diabetes Association Professional Practice Committee. Glycemic Goals, Hypoglycemia, and Hyperglycemic Crises: Standards of Care in Diabetes—2026. Diabetes Care. 2026. Available through the ADA Standards of Care.
- American Diabetes Association Professional Practice Committee. Diabetes Technology: Standards of Care in Diabetes—2026. Diabetes Care. 2026. Available through the ADA Standards of Care.
- American Diabetes Association Professional Practice Committee. Management of Diabetes in Pregnancy: Standards of Care in Diabetes—2026. Diabetes Care. 2026. Available through the ADA Standards of Care.
- Battelino T, et al. Clinical Targets for Continuous Glucose Monitoring Data Interpretation: Recommendations From the International Consensus on Time in Range. Diabetes Care. 2019;42(8):1593–1603. DOI: 10.2337/dci19-0028. Foundational consensus reference for standard CGM targets.
- Bergenstal RM, et al. Glucose Management Indicator (GMI): A New Term for Estimating A1C From Continuous Glucose Monitoring. Diabetes Care. 2018;41(11):2275–2280. DOI: 10.2337/dc18-1581. Foundational reference explaining GMI.
- Kidney Disease: Improving Global Outcomes (KDIGO). KDIGO 2024 Clinical Practice Guideline for the Evaluation and Management of Chronic Kidney Disease. Kidney International. 2024. Official Guideline Resource.
About the Author
Dr. Pankaj Kumar
MBBS, DNB (Family Medicine)
General & Lifestyle Physician
Founder, Diet Plus Minus
Dwarka, New Delhi
Dr. Pankaj Kumar focuses on evidence-based management of type 2 diabetes, prediabetes, obesity, fatty liver and metabolic disorders through medical assessment, clinical nutrition and practical lifestyle modification.
Websites: www.dietplusminus.com | www.drpankajkumar.com
Medical Disclaimer
This article is intended for general medical education and does not replace personalised medical advice. Glucose targets and treatment decisions should be individualised according to diabetes type, age, pregnancy status, medication, comorbidities and hypoglycaemia risk. CGM readings may occasionally be inaccurate and should be confirmed when clinically indicated. Do not independently adjust insulin or other glucose-lowering medicines based solely on isolated CGM readings. Severe hypoglycaemia, persistent marked hyperglycaemia or symptoms suggesting a diabetes emergency require urgent medical evaluation.
Written by Dr. Pankaj Kumar , General & Lifestyle Physician, Dwarka, New Delhi